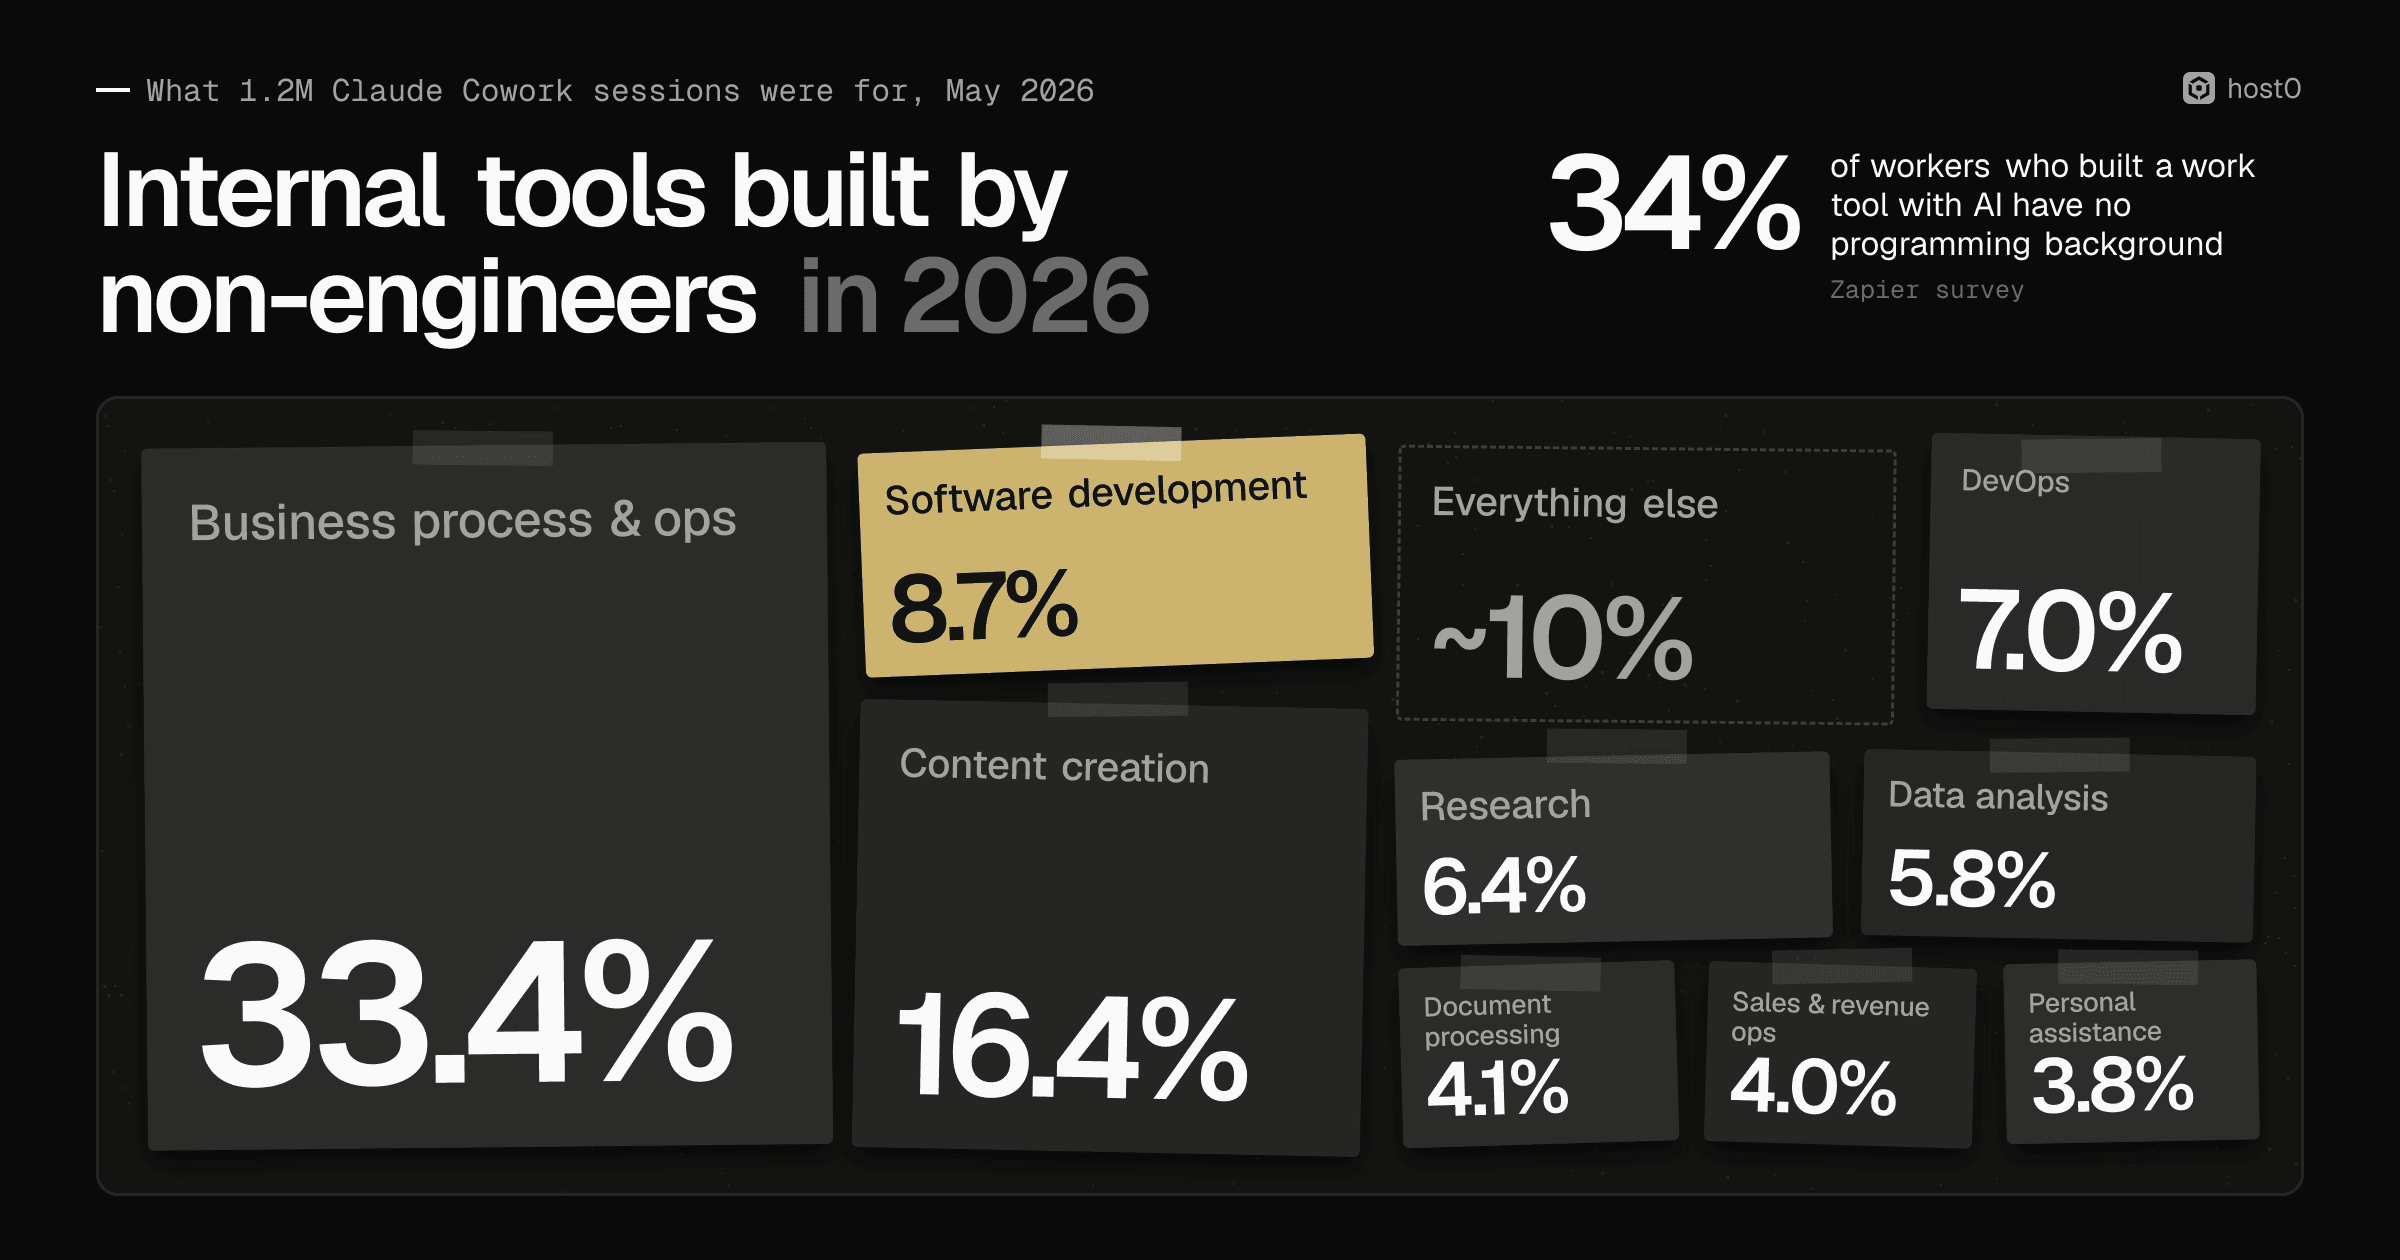
The people building software at work are no longer only the people who were hired to. A people team replaces its survey tool. A logistics company builds its own dock scheduler. A lawyer builds a phone tree that routes colleagues to the right lawyer. None of them writes the code; an agent does. Gartner has been predicting this for seven years under the name "citizen developers". Agents have made it far easier.
What nobody has is a clean count. No government statistic, Pew poll or developer survey asks how many people who aren't developers build their own tools. Every number on who builds is one of four things: a vendor surveying its own users, a vendor-sponsored panel, a platform's telemetry, or a Gartner forecast. We say which each time. Read together they still tell a consistent story: lots of people build, mostly small tools for their own teams, and those tools break in the same few places the spreadsheet did thirty years ago, plus two new ones: a public URL and a live database.
Key findings
- 1No neutral count of non-developer builders exists. The closest thing to a general-population number is a vendor-sponsored poll of 1,000 US adults: 13% have ever tried vibe coding, 57% have heard of it (All About Cookies with Base44, June 2026).
- 2Among people who already build, non-developers are a third to four-fifths, depending on who asks. Of about 800 US workers who built a work tool with AI, 34% had no formal programming background (Centiment for Zapier). Lovable says 80% of its builders are in self-identified non-technical roles.
- 3The biggest thing people bring to a work agent is operations, not software. In 1.2 million sampled Claude Cowork sessions in May 2026, business process and operations was 33.4% and software development 8.7%.
- 4What gets built looks like ops glue: trackers, dashboards, intake forms, onboarding portals, CRMs-lite, in the named cases. In Retool's survey of its own builders, the most-named categories are workflow automations (35%) and internal admin tools (33%).
- 5IT can't see all of it. Only 5% of tech and security leaders are "very confident" they see everything their teams have built (Retool), and 84% of CIOs agree employees build agents and apps faster than IT can govern them (Dataiku).
- 6The biggest exposures trace to an open default. From 38 million records in Power Apps portals in 2021 to about 5,000 corporate vibe-coded apps found on the open web in 2026, the pattern is a tool for non-engineers that left data public unless someone switched it off.
- 7Gartner now forecasts disposal, not adoption. Its 2019–2023 calls were about how many people would build. Its 2026 calls include that 80% of new apps will be "intentionally disposable" by 2029. We found no Gartner check of any earlier forecast against data.
8.7%
Claude Cowork sessions that were software development; operations work was 33.4%
May 2026
Source: Anthropic
34%
Of ~800 US workers who built a work tool with AI, share with no formal programming background
vendor survey
Source: Zapier / Centiment
~5,000
Corporate vibe-coded apps found on the open web; about 40% exposed sensitive data
RedAccess, vendor
Source: Axios
5%
Tech and security leaders very confident they see everything their teams have built
n = 307, vendor
Source: Retool
Who builds#
Start with the general public. In a June 2026 poll of 1,000 US adults by All About Cookies with Base44, Wix's app builder, 57% had heard of vibe coding, 13% had ever tried it, and 59% said they had an idea for an app, tool or website. The poll was sponsored by a company that sells to exactly those people, and it doesn't say whether the panel is representative. Treat 13% as an order of magnitude, not a census.
Among people who already build, the share without a technical background depends heavily on who's counting.
The Zapier number is the most useful because its sample is defined by what people did, not which product they use: Centiment surveyed US workers who had built or deployed a functional work tool in the past 12 months, and a third of them had no coursework and no developer job. Retool's CEO David Hsu told The New Stack that non-developers were "maybe 10%" of Retool users a few years ago and "closer to 50%" now. Lovable's 80% comes from its own usage data and a May 2026 survey; TNW called it "self-reported and unaudited". For contrast, Zapier's 2022 no-code report found that nearly 9 in 10 no-code users had some prior technical knowledge. Before agents, most no-code users had some technical background.
The highest number around is Clutch's: 64% of 700+ full-time workers said in September 2026 that they had built their own AI agent, and 91% of those agents touch company data. Clutch doesn't define "built" or publish a method, and the figure is far above every other source, so read it as an upper bound.
What the platforms see#
Telemetry is better than surveys at one thing: showing what people actually ask agents to do. Anthropic sampled 1.2 million Claude Cowork sessions from more than 600,000 organizations between 11 and 31 May 2026.
What people use Claude Cowork for
Share of 1.2M sampled sessions by work category, 11–31 May 2026
| Label | Value |
|---|---|
| Business process and operations | 33.4% |
| Content creation and copywriting | 16.4% |
| Software development | 8.7% |
| DevOps and infrastructure | 7.0% |
| Research and intelligence | 6.4% |
| Data analysis and BI | 5.8% |
| Document processing | 4.1% |
| Sales and revenue operations | 4.0% |
| Personal assistance | 3.8% |
| Everything else | ~10% |
Source: Anthropic, July 2026
Non-engineers show up even in Claude Code, a tool built for programmers. Across about 400,000 sessions from October 2025 to April 2026, Anthropic found that Business and Financial Operations was the second-largest occupation group after software, and management, sales and legal were the fastest-growing non-software groups. It publishes a rank order, not percentages. OpenAI reported in December 2025 that coding-related messages from functions outside engineering, IT and research rose 36% in six months.
Claude Code success, software jobs vs everyone else
Approximate share of sessions reaching verified success, by inferred occupation, Oct 2025 – Apr 2026
| Label | Value |
|---|---|
| Software occupations, all sessions | 30% |
| Other occupations, all sessions | 26% |
| Software occupations, code sessions | 34% |
| Other occupations, code sessions | 29% |
Source: Anthropic, June 2026
The largest low-code base#
Microsoft's Power Platform is probably the biggest pre-agent home for tools built outside IT, and its growth is the longest public series. One caution: Microsoft reports monthly active users, everyone who uses a Power App, flow or agent, not the people who make them. We found no Microsoft count of makers.
Power Platform monthly active users
Millions of users (not makers), as stated by Microsoft, Oct 2021 – Sep 2025
| x | y |
|---|---|
| Oct 2021 | 20M (~20M) |
| Apr 2023 | 33M (~33M) |
| Jul 2024 | 48M (48M) |
| Sep 2025 | 56M |
Sources: MSDynamicsWorld; MSDynamicsWorld; IANS via Siasat; MSDynamicsWorld (PPCC 2025)
In April 2026 Microsoft said "nearly 90% of the Fortune 500 now have active agents built with our low-code/no-code tools". That's a count of companies, not people.
Seven years of forecasts#
Gartner has made citizen-developer forecasts repeatedly since 2019. Two of the target years below, 2023 and 2024, have passed and a third is this year, and we found no Gartner release that checks any of them against data. Its two measurements don't settle it either: 41% of employees were "business technologists" in a 2021 survey, and 26% of business-area staff were dedicated to technology work in a 2024 one, but the two use different bases and can't be compared.
Gartner on people who build outside IT
Forecasts by the date they were made, with their target year; measurements marked
Oct 2019
Oct 2019
Forecast: citizen developers 4× professionals by 2023
At large enterprises. Reported by CIO.com; Gartner's own text not found. No follow-up published.10 Jun 2021
10 Jun 2021
Forecast: 80% of tech built by non-tech professionals by 2024
Gartner counted AI-generated software among the non-professional builders. No follow-up published.13 Mar 2022
13 Mar 2022
Measurement: 41% of employees are business technologists
Staff outside IT who build technology or analytics capabilities, from a 2021 survey.13 Dec 2022
13 Dec 2022
Forecast: 80% of low-code users outside IT by 2026
Up from 60% in 2021. No follow-up published.28 Mar 2023
28 Mar 2023
Forecast: 75% of employees acquire, modify or create tech outside IT's view by 2027
Up from 41% in 2022, in Gartner's cybersecurity predictions.22 Oct 2024
22 Oct 2024
Measurement: 26% of business-area staff work on technology
A different base from the 41%, so not a decline.2026
2026
Forecast: 60% of vibe-coded apps retired by 2028
Seen only in a vendor's summary of the Gartner report.15 Sep 2026
15 Sep 2026
Forecast: 80% of new apps disposable by 2029
Used for less than a year, built by non-technical staff for short-term needs.
Sources: Gartner press releases; CIO.com; VentureBeat; Tray.ai
The tone changed. The early forecasts were about how many people would build. The 2026 ones are about how fast what they build gets thrown away.
What they build#
No neutral source counts the types of internal tools people make. Three sources come close from different angles, and all three put business operations near the top.
The first is the Cowork mix above, which is demand: what people bring to a work agent. The second is Retool's February 2026 survey of 817 of its builders, mostly its own customers, on what they've built or replaced with custom software.
What builders have built or replaced
Percent, Retool survey of 817 builders (base unclear), late 2025
| Label | Value |
|---|---|
| Workflow automations | 35% |
| Internal admin tools | 33% |
| Business intelligence | 29% |
| CRMs and form builders | 25% |
| Project management | 23% |
| Customer support | 21% |
Source: Retool, Feb 2026
The third is our own. When we classified 300 random public repositories from Lovable and Google AI Studio for Is vibe coding replacing SaaS?, 22.0% of the Lovable ones were business software, internal or customer-facing, with names like fleetmanagement, HR-and-Payroll, approval-path and room-booker, against 6.0% of random GitHub repos. Private internal tools never reach public GitHub, so the sample can't see them.
The named cases fill in the shape. Every number here is the company's or its vendor's claim.
Named cases: who built what
Company and vendor claims, 2025–2026
- Rokt. More than 700 employees, including non-technical staff, built 135 internal apps in a 24-hour hackathon on Replit: dashboards, workflow tools, training quizzes, a searchable library of SQL queries.
- The Scion Group. Marketing, HR and finance staff at the student-housing company put 24 apps into production on Lovable in under four months, with 77 more in development. Lovable says the first build saved $35,000.
- Productiv. The logistics company built dock scheduling, compliance, inspection and returns tools on Lovable; an inspection went from an hour to two minutes, it says.
- Netlify's people team. Four people, "none of us are engineers", replaced their survey tool, built hiring dashboards and a gamified onboarding, and say they save more than $10,000 a year in software.
- Anthropic's lawyers and marketers. Lawyers built a phone tree to route colleagues to the right lawyer; growth marketers generate hundreds of ad variations in seconds.
- SaaStr. A non-engineer replaced a paid sponsor portal in about a day and a half, and concluded that "every app you build is an app you now have to maintain".
Sources: Replit (Rokt); Lovable (Scion); Lovable (Productiv); Netlify; Anthropic; SaaStr
How many people use a typical internal tool? Nobody publishes a distribution. The proxies, 135 apps from one hackathon and 101 apps live or in development at one housing company in four months, point the same way: many small apps, most of them for small groups. A Rokt interviewee told Sacra that Replit works best for "small team workflows", and that company-wide reliability and permissions stay on other systems.
Where it breaks#
The tools work well enough to be relied on. That's when the problems start, and they follow one path.
How an internal tool breaks
step 1
Built
An afternoon with an agent, by the person who has the problem
step 2
Shared
A link sent to the team, often public because that was the default
step 3
Relied on
Real data goes in; the team stops using the old tool
step 4
Breaks
Data exposed, the builder moves on, or a bill nobody owns
Source: Our synthesis
IT can't see it#
The surveys we found of the people responsible for this all say the same thing: building has outrun oversight. Most of them come from companies that sell the fix.
Built outside IT's view
Percent, each from a different survey or scan, 2024–2026
| Label | Value |
|---|---|
| Leaders not very confident they see everything | 95% (Retool) |
| CIOs: employees build faster than IT can govern | 84% (Dataiku) |
| CIOs lacking full oversight of outside agents | 81% (Dataiku) |
| Low-code copilots overshared, public included | 63% (Zenity) |
| Builders who built outside IT oversight | 60% (Retool) |
Zenity, which sells security for these tools, put the scale in one line in 2024: an average large enterprise had about 80,000 apps and copilots built outside the normal development process, with roughly 50,000 vulnerabilities among them. In Retool's June 2026 survey, about one in five leaders reported a production incident caused by an AI-generated internal tool, and 51% answered "not to my knowledge, but I can't say for certain".
It isn't only apps. Employees bring their own AI tools as a matter of course, and every survey asks a slightly different question.
Employees using AI and apps IT didn't give them
Percent of respondents, each survey's own question, 2024–2026
| Label | Value |
|---|---|
| Use unapproved AI tools | 81% (UpGuard) |
| AI users bringing their own AI | 78% (Microsoft) |
| Downloaded apps without IT approval | 52% (1Password) |
| Sign in to AI with a personal login | 47% (Merge) |
| Use AI in ways that break policy | 44% (KPMG) |
| Orgs: unapproved use as approved tools lag | 33% (OneTrust) |
Sources: UpGuard; Microsoft; 1Password; Merge; KPMG; OneTrust
OneTrust's number is the one to act on: a third of organizations saw people go around the rules because the approved tools didn't arrive fast enough. Gartner's advice on agent sprawl makes the same point, that staff who are blocked "will likely go around the organization's controls".
The default was open#
The worst breaks aren't bugs in clever code. They're settings. For five years, most of the large exposures of tools built by non-engineers have followed one script: the platform left data or the app reachable by anonymous visitors unless the builder changed it, the vendor called it customer configuration, and in several cases the default then changed.
The default was open
Reported exposures in tools built by non-engineers, 2021–2026
Aug 2021
Aug 2021
Power Apps portals: 38M records, 47 organizations
COVID contact tracing, vaccination appointments and some Social Security numbers, readable anonymously through OData feeds. Microsoft then turned table permissions on by default.Aug 2024
Aug 2024
Copilot Studio bots published without sign-in
Zenity said at Black Hat that tens of thousands of bots were reachable from the internet because the defaults published them without authentication.Sep 2024
Sep 2024
63% of low-code copilots overshared
Shared with the whole enterprise and the public, in Zenity's telemetry of 2,600+ copilots.Nov 2024
Nov 2024
Power Pages: 1.1M NHS staff records
Table permissions granted to 'Anonymous' at an NHS shared-services provider; fixed after AppOmni's disclosure.Mar 2025
Mar 2025
Lovable: 170 of 1,645 showcase apps
Missing or wrong database access rules (CVE-2025-48757, disputed by Lovable).Jul 2025
Jul 2025
Base44: private enterprise apps opened
Undocumented endpoints let outsiders into SSO-only apps. A platform bug rather than a setting; fixed in under 24 hours.Nov 2025
May 2026
May 2026
About 5,000 corporate vibe-coded apps on the open web
RedAccess, which sells a security product, said roughly 40% exposed sensitive data; privacy defaults were public unless switched. The platforms dispute parts of it.
Sources: Dark Reading; The Register; Zenity; TechRepublic; Matt Palmer; Wiz; Lovable; Axios
The 2026 case is the clearest. RedAccess looked at 380,000 public assets built with Lovable, Base44, Replit and Netlify and counted about 5,000 corporate apps. WIRED reported that some could be opened by anyone with the URL and others asked only for an email address, with no real check; Axios verified a Brazilian bank's internal financial information among them. Replit said public apps being reachable is expected, Lovable said configuration is the developer's responsibility, and Wix said it hadn't been given the URLs. Each may be true, and none helps a marketing manager who never knew there was a setting.
None of these has a confirmed count of people who actually took the data. Exposed isn't the same as breached. We wrote about the security side in detail in Vibe-coded app security in 2026.
Nobody owns it#
The second break is slower. The builder changes teams or leaves, and the tool keeps running with nobody who can fix it. Microsoft documents what happens on its own platform: when an owner leaves, their canvas apps keep working but only an owner can change them, and their flows stop until an admin finds and reassigns them. For AI-built tools we found no measurement. Zapier reports that 54% of the surveyed builders without a programming background say their tools are still in use, and only 24% that all of them are.
Maintenance is where the enthusiasm cools. Ohalo's CEO David Friedberg said on Salesforce's August 2026 earnings call that after vibe coding a CRM over a weekend, "you quickly realize just how much it takes to do maintenance". Gartner's forecast, in a 2026 report summarised by Tray.ai, is that 60% of vibe-coded apps will be retired by 2028 for failing to deliver predictable value, and that 30% of software engineering teams will be strained maintaining apps built by citizen developers. That's a forecast. So is the 80% of new apps "intentionally disposable" by 2029, for which Gartner's advice is "automated registries" of business-created apps. If most of these tools are meant to be thrown away, the risk is the ones that aren't, and nobody knowing which is which. The money side, from forgotten subscriptions to stolen keys, is in What it costs to run a vibe-coded app in 2026.
We've been here before#
Spreadsheets are the original internal tool built by a non-engineer, and the research on them is thirty years deep. Raymond Panko's field audits found errors in 88% of 113 spreadsheets audited between 1995 and 2007. Those were sheets chosen for audit, not a random sample, but the failures since look a lot like the ones above.
The spreadsheet precedent
Public spreadsheet failures, 2012–2023
- Police Service of Northern Ireland, 2023. A spreadsheet released under a freedom-of-information request carried a hidden tab with the surname, rank and role of all 9,483 officers and staff. The ICO fined it £750,000.
- Public Health England, 2020. 15,841 positive COVID cases were left out of the daily figures, and contact tracing delayed, because a pipeline used an old Excel format with a row limit.
- JPMorgan, 2012. A risk spreadsheet behind the "London Whale" trades divided by a sum instead of an average, understating risk, according to the bank's own task force.
- Genetics papers, 2014–2020. Excel's auto-formatting mangled gene names in 30.9% of papers with Excel gene lists, up from about 20% in an earlier screen, after the problem was public.
Sources: ICO; The Register; Baseline Scenario; PLOS Comp Biol
The gene-name case is the warning. The error was well known, the fix was known, and the rate went up anyway. Knowing about a risk didn't change the defaults people worked with.
What this means if you run or build internal tools#
- Make private the default. Every large exposure above started with an app that was public until someone changed it. Start every tool closed and open it on purpose.
- Sign in with the company email. Share with named colleagues, and make access end when their account does. A link anyone can forward isn't access control, and "enter any email" isn't sign-in. Claude's artifacts, for example, need a Claude account to open and stay inside a Team or Enterprise organization by default (how they work).
- Give every tool a named owner, and a second one. Write down who can fix it. When the builder leaves, the tool should move to someone, not stop or drift.
- Keep the data in a governed store. Not in the page, not in a spreadsheet tab, not behind a database key shipped in the front end. Use a backend with access rules you can read, and export it regularly.
- Put caps on anything that spends money. Budget limits on every API key, spend caps on every hosting plan, and keys server-side only.
- Keep an inventory. Gartner's advice is a registry of business-built apps. Even a shared list of what exists, who owns it and what data it touches beats the 5% confidence in Retool's survey.
- Make the approved path faster than the workaround. A third of organizations in OneTrust's survey saw people go around the rules because approved tools were too slow. If building is easy, a safe place to put what got built has to be easy too.
host0 hosts what your agent made, from any agent: apps, sites and PDFs at a link that's private by default, shared with colleagues by email invite, with a shared records database instead of keys in the page. It's built for exactly these one-team tools, wherever the agent that made them runs.
Methodology#
This post merges three research passes run on 18 October 2026 (adoption, what gets built, where it breaks) and our earlier research packs, including the enterprise data in Enterprise AI adoption in 2026. Most vendor and analyst pages couldn't be opened from our research environment, so most figures come from search-engine extracts of the named pages and from syndicated press releases. We read Anthropic's Cowork and Claude Code pages directly, and spot-checked about 20 of the numbers this post leans on with independent searches. We dropped a widely repeated claim that Zillow employees built 7,000 apps on about 600 Replit seats, because we couldn't find it outside one aggregator.
Almost every survey here comes from a company that sells something its results favour: app builders reporting how many of their users are non-technical, and security and governance vendors reporting how much is out of control. We name the sponsor each time. Gartner figures are labelled as forecasts or measurements; none of the forecasts has been checked. The Cowork categories are tasks in agent sessions, not deployed tools; Power Platform figures are users, not makers; Clutch's 64% is an upper bound with "built" undefined. The repository sample is ours, from a single rater, and covers only public repositories. Nothing in this post postdates 18 October 2026.
Open questions#
- How many people who aren't developers build their own tools? No neutral survey asks. The incidence behind Zapier's ~800 builders (how many workers were screened to find them) would be the best number available.
- How many people use a typical internal tool, and for how long? Nobody publishes a distribution of users or lifetimes. Gartner's 60% retired and 80% disposable are forecasts.
- What happens to an AI-built tool when its builder leaves? Only Microsoft documents it, for its own platform.
- Did changing the default work? Microsoft turned on table permissions in 2021 and Lovable made new projects private in 2025. Neither published an exposure rate before and after.
- How often are these tools wrong, not just insecure? Nobody has audited a sample of AI-built internal tools for logic errors the way Panko audited spreadsheets.
- Will a regulator act? We found no fine or lawsuit tied to an AI-built internal tool as of 18 October 2026.