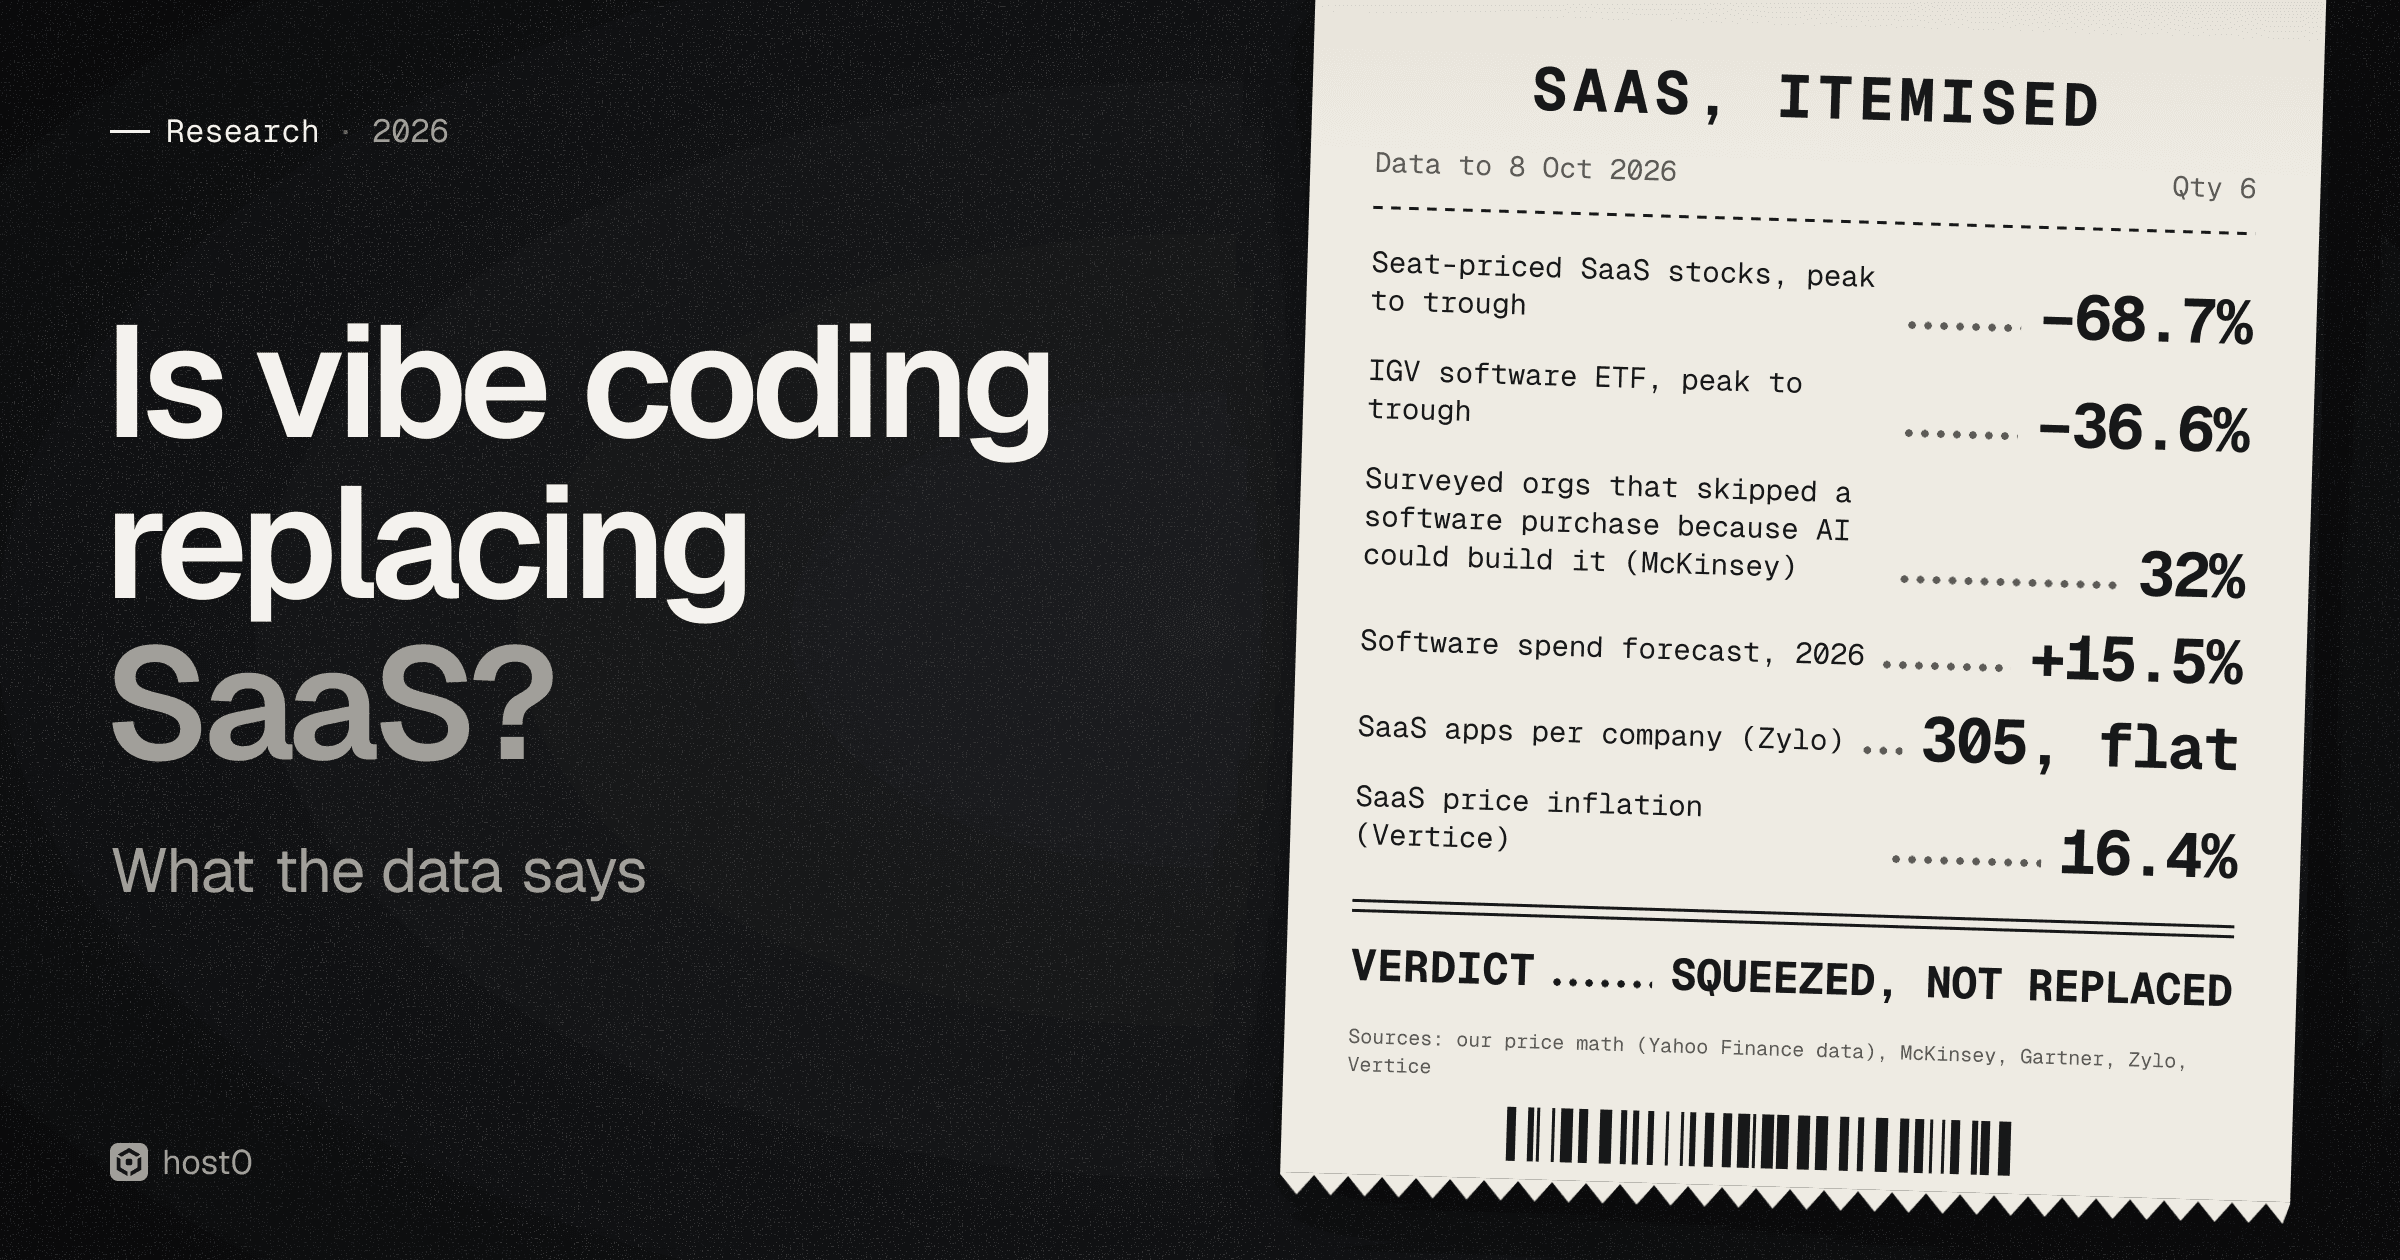
"Why pay for SaaS when your agent can build it?" became one of the loudest questions in software this year. Klarna's CEO said in 2024 that his company had shut down Salesforce and Workday, AI labs shipped agents that do office work, and in February 2026 a week of selling, which traders called the SaaSpocalypse, wiped about $1 trillion in market value on Wall Street, by Reuters' count. If vibe coding is replacing SaaS, it should show up somewhere other than the stock market: in vendors' revenue, in what companies spend, in what they say they skip buying, and in what people actually build.
So we looked in all of those places. We pulled two and a half years of share prices, the weekly valuation and growth series that software investors track, every spend forecast and SaaS-management index we could find, the build-versus-buy surveys and the case studies behind the headlines, and we counted what gets built on GitHub ourselves. The short answer: no, not yet, not in aggregate. Spend and app counts are still growing and the vendors' fundamentals held. But SaaS is being squeezed: the market repriced seat-based software hard, about a third of surveyed companies skipped at least one purchase, buyers have more leverage over cheap point tools, and the infrastructure that agents build on is winning. Vendor numbers are labelled as claims, and this is a description of what happened, not investment advice.
Key findings
- 1The market priced in replacement. Our equal-weight basket of nine seat-priced SaaS stocks fell 68.7% from February 2025 to June 2026, and the IGV software ETF fell 36.6% from September 2025 to April 2026. On 7 October the basket was still 52% below its peak, while IGV was up 3.9% for the year and the Nasdaq-100 23.8%.
- 2The multiple halved; the businesses didn't. The median cloud-software company's value fell from 6.6 to 2.9 times next year's revenue in Clouded Judgement's index, while its median expected growth stayed at 12–13% and net retention at 108–110%.
- 3Spending is still going up. Gartner raised its 2026 software forecast twice during the selloff, to +15.5% and $1.468 trillion. Zylo counts a flat 305 apps per company with spend up 8%; BetterCloud counts app portfolios growing again.
- 4A third skip something. 32% of respondents to McKinsey's 2026 survey (n = 1,719) said their organization decided against buying at least one software product or feature because agentic coding tools could build it. In Retool's sample of its own builders, 35% have replaced a SaaS tool.
- 5The famous case was walked back. Klarna's CEO later wrote "we did not replace SaaS with an LLM"; it shut down about 1,200 SaaS, by an internal estimate, while consolidating onto its own stack. The replacements that do show up are cheap point tools, and one public reversal went back to Linear over maintenance.
- 6People don't vibe-code Notion clones. Named B2B SaaS clones fell from 72 to 26 per million new public GitHub repos between Q1 2025 and Q3 2026, by our count. What AI app builders do produce is bespoke business software: 15.7% of a random sample, against 6.0% of all new repos.
- 7Maintenance decides the math. With two hours of upkeep a month, a built replacement for a $8–20 seat tool costs more than the subscription below roughly 15 to 37 seats, in our illustrative model. With a week of security work every two months, it loses below roughly 101 to 255 seats.
- 8The infrastructure wins. Supabase says more than 60% of new databases are launched by AI tools and Vercel that 30% of its apps came from agents. Infrastructure and dev-tools stocks returned +68.5% in a year to June; business applications −36.2%.
−68.7%
Equal-weight basket of 9 seat-priced SaaS stocks, peak (Feb 2025) to trough (Jun 2026)
Our analysis
Source: host0 analysis of daily adjusted closes
32%
McKinsey 2026 respondents whose organization skipped buying at least one software product or feature because agentic coding tools could build it (n = 1,719)
Source: McKinsey
+15.5%
Gartner forecast for worldwide software spending growth in 2026, to $1.468 trillion
Source: Gartner
26
Named B2B SaaS clones per million new public GitHub repos, Q3 2026; 72 in Q1 2025
Our count
Source: host0 count, GitHub search API
What the market did#
The selloff had a shape. Software stocks had lagged the rest of tech through 2025, then fell in steps in early 2026, each step tied to an AI release or an earnings report. To separate SaaS from software in general we built a simple basket: equal weights in nine companies that mostly sell per-seat subscriptions to business users, namely Salesforce, Adobe, Atlassian, HubSpot, monday.com, Workday, ServiceNow, Wix and Intuit. It peaked on 10 February 2025 and fell 68.7% to its low on 25 June 2026. IGV, the most-traded software ETF, fell less, 36.6% from its 22 September 2025 high to 10 April 2026, because it's weighted by market value and holds Microsoft, Oracle and Palantir, which held up.
Software stocks against the Nasdaq-100
Month-end adjusted close, indexed to 2 Jan 2024 = 100, Jan 2024 to 7 Oct 2026
| Series | x | y |
|---|---|---|
| QQQ | 2 Jan 2024 | 100 |
| QQQ | 31 Jan 2024 | 103.6 |
| QQQ | 29 Feb 2024 | 109 |
| QQQ | 28 Mar 2024 | 110.4 |
| QQQ | 30 Apr 2024 | 105.6 |
| QQQ | 31 May 2024 | 112.1 |
| QQQ | 28 Jun 2024 | 119.4 |
| QQQ | 31 Jul 2024 | 117.4 |
| QQQ | 30 Aug 2024 | 118.6 |
| QQQ | 30 Sep 2024 | 121.8 |
| QQQ | 31 Oct 2024 | 120.7 |
| QQQ | 29 Nov 2024 | 127.2 |
| QQQ | 31 Dec 2024 | 127.7 |
| QQQ | 31 Jan 2025 | 130.5 |
| QQQ | 28 Feb 2025 | 127 |
| QQQ | 31 Mar 2025 | 117.3 |
| QQQ | 30 Apr 2025 | 119 |
| QQQ | 30 May 2025 | 129.9 |
| QQQ | 30 Jun 2025 | 138.2 |
| QQQ | 31 Jul 2025 | 141.5 |
| QQQ | 29 Aug 2025 | 142.9 |
| QQQ | 30 Sep 2025 | 150.6 |
| QQQ | 31 Oct 2025 | 157.8 |
| QQQ | 28 Nov 2025 | 155.3 |
| QQQ | 31 Dec 2025 | 154.3 |
| QQQ | 30 Jan 2026 | 156.2 |
| QQQ | 27 Feb 2026 | 152.5 |
| QQQ | 31 Mar 2026 | 145.1 |
| QQQ | 30 Apr 2026 | 167.9 |
| QQQ | 29 May 2026 | 185.6 |
| QQQ | 30 Jun 2026 | 185.4 |
| QQQ | 31 Jul 2026 | 173.2 |
| QQQ | 31 Aug 2026 | 180.4 |
| QQQ | 30 Sep 2026 | 186.4 |
| QQQ | 7 Oct 2026 | 190.9 |
| IGV | 2 Jan 2024 | 100 |
| IGV | 31 Jan 2024 | 106.6 |
| IGV | 29 Feb 2024 | 109.1 |
| IGV | 28 Mar 2024 | 108.1 |
| IGV | 30 Apr 2024 | 100.1 |
| IGV | 31 May 2024 | 99 |
| IGV | 28 Jun 2024 | 110.2 |
| IGV | 31 Jul 2024 | 107.3 |
| IGV | 30 Aug 2024 | 110 |
| IGV | 30 Sep 2024 | 113.3 |
| IGV | 31 Oct 2024 | 115.7 |
| IGV | 29 Nov 2024 | 132.8 |
| IGV | 31 Dec 2024 | 126.9 |
| IGV | 31 Jan 2025 | 130.4 |
| IGV | 28 Feb 2025 | 123.6 |
| IGV | 31 Mar 2025 | 112.8 |
| IGV | 30 Apr 2025 | 121.8 |
| IGV | 30 May 2025 | 131.4 |
| IGV | 30 Jun 2025 | 138.8 |
| IGV | 31 Jul 2025 | 141.6 |
| IGV | 29 Aug 2025 | 137.1 |
| IGV | 30 Sep 2025 | 145.8 |
| IGV | 31 Oct 2025 | 146.4 |
| IGV | 28 Nov 2025 | 132 |
| IGV | 31 Dec 2025 | 134 |
| IGV | 30 Jan 2026 | 114.5 |
| IGV | 27 Feb 2026 | 103.4 |
| IGV | 31 Mar 2026 | 101.5 |
| IGV | 30 Apr 2026 | 106.4 |
| IGV | 29 May 2026 | 128.9 |
| IGV | 30 Jun 2026 | 114.9 |
| IGV | 31 Jul 2026 | 119.9 |
| IGV | 31 Aug 2026 | 139.5 |
| IGV | 30 Sep 2026 | 135 |
| IGV | 7 Oct 2026 | 139.3 |
| SaaS basket | 2 Jan 2024 | 100 |
| SaaS basket | 31 Jan 2024 | 109.8 |
| SaaS basket | 29 Feb 2024 | 110.9 |
| SaaS basket | 28 Mar 2024 | 107.7 |
| SaaS basket | 30 Apr 2024 | 97.2 |
| SaaS basket | 31 May 2024 | 98.1 |
| SaaS basket | 28 Jun 2024 | 106.6 |
| SaaS basket | 31 Jul 2024 | 104.1 |
| SaaS basket | 30 Aug 2024 | 108.9 |
| SaaS basket | 30 Sep 2024 | 109.6 |
| SaaS basket | 31 Oct 2024 | 112.5 |
| SaaS basket | 29 Nov 2024 | 129.9 |
| SaaS basket | 31 Dec 2024 | 123.5 |
| SaaS basket | 31 Jan 2025 | 131 |
| SaaS basket | 28 Feb 2025 | 124.8 |
| SaaS basket | 31 Mar 2025 | 105.5 |
| SaaS basket | 30 Apr 2025 | 113.3 |
| SaaS basket | 30 May 2025 | 114.9 |
| SaaS basket | 30 Jun 2025 | 116.3 |
| SaaS basket | 31 Jul 2025 | 106.6 |
| SaaS basket | 29 Aug 2025 | 98.7 |
| SaaS basket | 30 Sep 2025 | 100.8 |
| SaaS basket | 31 Oct 2025 | 100 |
| SaaS basket | 28 Nov 2025 | 82.9 |
| SaaS basket | 31 Dec 2025 | 87 |
| SaaS basket | 30 Jan 2026 | 67.8 |
| SaaS basket | 27 Feb 2026 | 55.7 |
| SaaS basket | 31 Mar 2026 | 55.8 |
| SaaS basket | 30 Apr 2026 | 51 |
| SaaS basket | 29 May 2026 | 55.9 |
| SaaS basket | 30 Jun 2026 | 45.1 |
| SaaS basket | 31 Jul 2026 | 54.9 |
| SaaS basket | 31 Aug 2026 | 73.3 |
| SaaS basket | 30 Sep 2026 | 63.3 |
| SaaS basket | 7 Oct 2026 | 64.9 |
Sources: Yahoo Finance daily adjusted closes; host0 analysis
The worst days line up with specific news. On 30 January Anthropic launched plug-ins for its Claude Cowork agent that would "automate tasks across legal, sales, marketing and data analysis", and the following Tuesday Thomson Reuters had its biggest one-day loss on record. Earnings did as much damage as AI launches: ServiceNow's margin guidance on 23 April gave IGV its worst day in our window, and Salesforce's AI revenue on 27 August its best.
The selloff, day by day
IGV daily move and distance from its 22 Sep 2025 high, with the trigger reported that day, Jan to Aug 2026
29 Jan 2026
29 Jan 2026
Microsoft, SAP and ServiceNow report; ServiceNow −9.9%, HubSpot −11.2%.30 Jan 2026
30 Jan 2026
IGV −2.1%: Claude Cowork plug-ins
Anthropic's agent gets plug-ins for legal, sales, marketing and data analysis.3 Feb 2026
3 Feb 2026
IGV −4.6%: the legal plug-in selloff
Thomson Reuters nearly −18%, RELX −14%, LegalZoom −19.7%; Intuit −10.9%.5 Feb 2026
23 Feb 2026
23 Feb 2026
Reuters: the software index touched a 10-month low after Citrini Research's 2028 scenario note.10 Apr 2026
10 Apr 2026
After Anthropic held back its Mythos model and UBS downgraded ServiceNow.23 Apr 2026
23 Apr 2026
ServiceNow beats but trims its subscription margin guide; its stock −17.7%.6 Aug 2026
6 Aug 2026
Beat, but guided net customer additions and growth lower. Atlassian rose 35.3% the next day on 31% cloud growth.27 Aug 2026
Sources: Reuters via Yahoo Finance; Reuters via Kitco; Fortune; Sherwood; host0 analysis of daily closes
The damage was deepest at the companies that sell seats to business users or help small businesses build things themselves. Figma, Wix, Atlassian and monday.com each fell more than 80% from their 2025 highs. Recoveries since have been uneven: Atlassian is back to 39% below its peak after re-accelerating cloud growth, while monday.com and HubSpot are still more than 70% down.
How far the SaaS names fell
Decline from the highest close since 1 Jan 2025 to the lowest close after it, adjusted closes, to 7 Oct 2026
| Label | Value |
|---|---|
| Figma | −86.2% (now −82.3% from peak) |
| Wix | −83.6% (now −70.4%) |
| Atlassian | −82.3% (now −39.4%) |
| monday.com | −82.1% (now −74.5%) |
| HubSpot | −79.2% (now −73.1%) |
| Intuit | −68.2% (now −62.8%) |
| GoDaddy | −65.0% (now −54.6%) |
| ServiceNow | −64.5% (now −41.1%) |
| Workday | −59.5% (now −33.7%) |
| Adobe | −58.3% (now −49.8%) |
| Salesforce | −57.8% (now −36.8%) |
| IGV (software ETF) | −36.6% (now −6.7%) |
Sources: Yahoo Finance daily adjusted closes; host0 analysis
The split is between kinds of software, not between software and everything else. Tomasz Tunguz grouped 87 public software companies by what they sell: over the year to 30 June 2026, infrastructure and developer tools returned 68.5% and business applications lost 36.2%. His summary: "The market buys the AI stack & sells the seat-priced application layer."
What the businesses did#
If customers were replacing SaaS with their own code, it would show up as slower growth and falling net retention, the revenue a vendor keeps and expands from last year's customers. It hasn't, so far. In the cloud-software universe that Altimeter's Jamin Ball tracks every week, the median company was valued at 6.6 times its expected next-twelve-months revenue at the end of January 2025 and 2.9 times in June 2026, a 56% fall by our arithmetic. In January he wrote that "confidence in the SaaS business model has shattered". Over the same period the median company's expected growth stayed at 12–13%.
What investors pay for a dollar of SaaS revenue
Median enterprise value ÷ next-twelve-months revenue, Clouded Judgement cloud-software index, last weekly reading of each month, Dec 2023 to Oct 2026
| x | y |
|---|---|
| Dec 2023 | 6.5× |
| Jan 2024 | 6× |
| Feb 2024 | 6.1× |
| Mar 2024 | 6.4× |
| Apr 2024 | 5.8× |
| May 2024 | 5.2× |
| Jun 2024 | 5.2× |
| Jul 2024 | 5.3× |
| Aug 2024 | 5.3× |
| Sep 2024 | 5.3× |
| Oct 2024 | 5.6× |
| Nov 2024 | 6.2× |
| Dec 2024 | 6.1× |
| Jan 2025 | 6.6× (6.6×) |
| Feb 2025 | 5.8× |
| Mar 2025 | 5.6× |
| Apr 2025 | 5× |
| May 2025 | 5.6× |
| Jun 2025 | 5.3× |
| Jul 2025 | 5.7× |
| Aug 2025 | 5.1× |
| Sep 2025 | 5.2× |
| Oct 2025 | 5.1× |
| Nov 2025 | 4.6× |
| Dec 2025 | 4.7× |
| Jan 2026 | 4.1× |
| Feb 2026 | 3.3× |
| Mar 2026 | 3.1× |
| Apr 2026 | 3× |
| May 2026 | 3.2× |
| Jun 2026 | 2.9× (2.9×) |
| Jul 2026 | 3.8× |
| Aug 2026 | 4.4× |
| Sep 2026 | 4.2× |
| Oct 2026 | 4.2× |
Sources: Clouded Judgement 1.30.26; Clouded Judgement 10.2.26; host0 month-end series from 146 weekly posts
The price fell, the fundamentals held
Medians in the Clouded Judgement cloud-software index at four dates, Jan 2025 to Oct 2026
Sources: Clouded Judgement; host0 month-end series
Meritech, which tracks its own index, saw the same: median net dollar retention bottomed around 107% and has "stabilized in the 107-109% range". Growth has slowed for years, to 16% on average in 2025, "its lowest level in a decade", but that's a slow, multi-year drift, not a 2026 cliff: the median expected growth in Ball's index was 14% at the end of 2023.
The company prints say the same, with caveats. Salesforce reported 11% growth in its August quarter, but that includes $456M from Informatica, which it bought; without it, growth was about 6.4% by our arithmetic against the prior year's $10,236M. Atlassian's revenue grew 28%, with cloud re-accelerating to 31%, and HubSpot's 20%, though HubSpot added fewer customers than it had guided. The pressure shows up in pricing more than in revenue: monday.com is moving new customers to seats plus consumption-based pricing, and Gartner says agentic AI "breaks the link between user growth and revenue growth" for many vendors. So far the bills haven't changed much: on Ramp's panel of 200+ vendors, seat-based contracts are still 65–75% of spend, consumption 4–6%.
What companies spend#
Gartner publishes a worldwide IT spending forecast every quarter. Its software line for 2026 went down slightly in February, to 14.7% growth from 15.2%, and then up twice during the selloff, to 15.1% in April and 15.5% in July. Gartner's own caveats matter: much of the growth is generative AI, including model development, and its analyst John-David Lovelock says "this is not a rising tide lifts all boats market trend". Price rises count too.
Gartner's 2026 software spending forecast, release by release
Forecast growth in worldwide software spending for 2026, %, by Gartner release, late 2025 to Jul 2026
| Label | Value |
|---|---|
| Before Feb 2026 | 15.2% (the forecast the Feb release revised) |
| Feb 2026 | 14.7% ($1,433.6B) |
| Apr 2026 | 15.1% ($1,443.6B) |
| Jul 2026 | 15.5% ($1,468B) |
Sources: Gartner, Feb 2026; Gartner, Apr 2026; Gartner, Jul 2026
The companies that manage SaaS subscriptions for their customers see their own slice of this, and none of them sees portfolios shrinking. Zylo says the average company manages 305 SaaS apps, down 0.07% in a year, while total SaaS spend rose 8% and spend on AI-native apps 108%. BetterCloud says app counts are back to growing, from 106 to 118, after two years of consolidation. Vertice measures prices: SaaS inflation reached 16.4% in June 2026, its highest on record, while spend per employee was flat at about $9,200 for three quarters. Rising prices and flat spend per head imply companies are buying somewhat less volume, but the index and the spend figure aren't the same basket, so that's a direction, not a number.
SaaS portfolios and spend in 2026
Latest figures from spend forecasts and SaaS-management vendors' customer data, Jan to Aug 2026
Sources: Gartner; Zylo; BetterCloud; Vertice inflation; Vertice spend; Tropic
Tropic's data has the sharpest warning in it: the median net dollar retention of "primarily SaaS" vendors among its customers slipped from 93% to 91% between April and July 2026. That's a vendor's panel, and still a growing market, but it's the direction to watch.
What buyers say they do#
The surveys say a real minority of companies are building instead of buying something. McKinsey's State of AI survey, fielded in May and June 2026, is the broadest: 32% of respondents said their organization had "decided against buying one or more software products or features because they could be built internally with agentic coding tools". Among the 6% it classes as AI high performers, "nearly half" said so, against 31% of others; respondents in technology and healthcare said it most. Note what the question measures: one skipped product or feature, possibly a small add-on, with no dollar amount.
Retool, which sells a platform for building internal tools, asked 817 builders, including its own customers: 35% had "replaced at least one SaaS tool with a custom build" and 78% expect to build more in 2026. Workflow automations (35%) and internal admin tools (33%) topped the list of what's being replaced. Read it as what builders in Retool's orbit do, not what companies in general do.
The evidence points the other way for AI software itself. Menlo Ventures found enterprises built 47% of their generative AI solutions in-house in 2024 and 24% in 2025; the rest they bought.
Build instead of buy, in the surveys
% of respondents, by survey and question; Menlo 2024 vs 2025, the others Nov 2025 to Jun 2026
| Label | Value |
|---|---|
| Retool: expect to build more tools in 2026 | 78% (817 builders incl. Retool customers, late 2025) |
| Menlo: genAI built in-house, 2024 | 47% (~495 US enterprise buyers) |
| Retool: replaced a SaaS tool | 35% (same 817 builders) |
| McKinsey: skipped a purchase they could build | 32% (n = 1,719, May–Jun 2026) |
| McKinsey: same, excluding AI high performers | 31% (high performers: “nearly half”) |
| Menlo: genAI built in-house, 2025 | 24% (Nov 2025; 76% bought) |
Sources: McKinsey; Retool; Menlo Ventures
The case studies#
The best-known case is Klarna. In August 2024 its CEO, Sebastian Siemiatkowski, told investors "we just shut down Salesforce. Within a few weeks, we will shut down Workday", and it became the poster child for AI replacing SaaS. Seven months later he explained what had happened: Klarna had consolidated its knowledge from many tools onto an internal stack built on the graph database Neo4j, "an internal estimate is about 1,200 SaaS shut down", and "not for the license fees". His conclusion: "So no, we did not replace SaaS with an LLM". Asked whether other companies would follow, he told TechCrunch "I doubt it".
The build-instead-of-buy cases, and how they turned out
Named cases of replacing SaaS with in-house software, Aug 2024 to Aug 2026
Sources: Klarna CEO on X; SaaStr, Feb 2026; SaaStr, Jul 2026; Lovable (eXp Realty); Platformer (Replit); Salesforce Q2 FY27 call; X (startup back on Linear)
The pattern across these is consistent with what SaaStr's Jason Lemkin wrote after his second replacement: the tools most exposed are point solutions "often priced $200 to $2,000/month" that stopped improving, not the platforms a business runs on.
What people actually build#
Surveys measure intentions. To see what people build, we counted on GitHub, where every new public repository has a name and a description we can search. Two measures, both run on 8 October 2026 over complete months from January 2025 to September 2026.
First, clones. We counted new public repositories whose name or description calls them a "clone" or an "alternative" of 16 named business SaaS products (Notion, Trello, Jira, Slack, Airtable, Calendly, Typeform, Zendesk, HubSpot, Linear, Todoist, Mailchimp, Shopify, DocuSign, Asana and Salesforce). If vibe coding meant people rebuilding their SaaS, this is where it would show. It went the other way: 889 such repositories in the first quarter of 2025 and 750 in the third quarter of 2026, while all new public repositories grew 2.4-fold. Per million new repositories, that's 72 down to 26. Clones of consumer apps, the classic "build Netflix to learn React" project, fell even faster.
Named B2B SaaS clones on GitHub
New public repos calling themselves a clone or alternative of 16 named B2B SaaS products, per million new public repos, by quarter, Q1 2025 to Q3 2026
| x | y |
|---|---|
| Mar 2025 | 72.1 (72) |
| Jun 2025 | 59.5 |
| Sep 2025 | 58.7 |
| Dec 2025 | 46.8 |
| Mar 2026 | 48.8 |
| Jun 2026 | 37.7 |
| Sep 2026 | 25.5 (26) |
Sources: GitHub search API; host0 count, 8 Oct 2026
"Alternative" as a label is growing, though. Repositories with the word in their description grew 4.1-fold, faster than GitHub, and repositories tagged self-hosted 32-fold. Most of those aren't product alternatives: in a hand-checked sample of 60 from the third quarter of 2026, 10 named a business or developer SaaS they replace, against 4 of 60 in early 2025. Agents that fill in repository topics may also explain part of the tag growth.
What grew on GitHub, and what didn't
Growth in new public repos per quarter, Q1 2025 to Q3 2026, times
| Label | Value |
|---|---|
| Tagged self-hosted | 32.2× (520 → 16,744; repos with any tag grew 2.0×) |
| “Alternative” in the description | 4.1× (1,946 → 8,018) |
| All new public repos | 2.4× (12.3M → 29.4M) |
| 16 named B2B SaaS clones | 0.84× (889 → 750) |
| 9 consumer-app clones | 0.65× (18,558 → 12,033) |
Sources: GitHub search API; host0 count, 8 Oct 2026
Second, what AI app builders produce. Lovable and Google AI Studio leave a default README on the apps their users export to GitHub, so we drew a random sample of 150 of each and 100 random new public repositories as a baseline, and classified each one by its name, description and first README lines. The single biggest identifiable category among the AI-builder apps is business software: internal tools and customer-facing business apps such as fleetmanagement, HR-and-Payroll, pos-redo, clinic-flow, approval-path and room-booker. That's 15.7% of the pooled sample (22.0% of Lovable's, 9.3% of AI Studio's), against 6.0% of random repositories. Not one of the 300 was a named clone of a business SaaS product. Websites, mostly small-business landing pages, were as common. We covered the builders themselves in AI app builders in 2026.
What AI app builders' users build
% of a random sample of Lovable and Google AI Studio repos exported to GitHub, n = 300, Jan 2025 to Sep 2026, with 95% intervals
| Label | Value |
|---|---|
| Unclear from the name | 33.3% (28.2–38.8 · random repos 26.0%) |
| Websites | 16.7% (12.9–21.3 · random repos 8.0%) |
| Business software | 15.7% (12.0–20.2 · random repos 6.0%) |
| Personal tracker or utility | 10.0% (7.1–13.9 · random repos 10.0%) |
| AI tool or chatbot | 8.0% (5.4–11.6 · random repos 4.0%) |
| Education or coursework | 5.7% (3.6–8.9 · random repos 26.0%) |
| Game | 4.3% (2.5–7.3 · random repos 1.0%) |
| E-commerce | 2.7% (1.4–5.2 · random repos 2.0%) |
| Other identifiable | 2.7% (1.4–5.2 · random repos 3.0%) |
| Dev tools or research code | 1.0% (0.3–2.9 · random repos 14.0%) |
Sources: GitHub search API; host0 sample and classification, 8 Oct 2026
The same pattern shows in open source. Projects that pitch themselves as alternatives to a SaaS product kept gaining GitHub stars: across 20 of them the median gain over the 12 months to 8 October was 29.7%, by our count from Wayback Machine snapshots. Twenty, a CRM, and Plane, a project tracker, grew fastest. Some of that is GitHub's own growth, and stars aren't installs, but self-hosting is clearly part of the "replace SaaS" story, and it isn't vibe coding: someone else maintains the code.
Open-source SaaS alternatives keep gaining stars
GitHub stars gained, Oct 2025 to 8 Oct 2026, % of the Oct 2025 count
| Label | Value |
|---|---|
| Twenty | +62.7% (Salesforce / HubSpot · 58.1K stars) |
| Plane | +54.8% (Jira / Linear · 60.5K) |
| Penpot | +50.2% (Figma · 60.8K) |
| Chatwoot | +47.2% (Intercom / Zendesk · 37.6K) |
| n8n | +43.0% (Zapier · 206.9K) |
| ERPNext | +35.3% (NetSuite / SAP · 39.9K) |
| listmonk | +32.2% (Mailchimp · 23.7K) |
| Documenso | +31.4% (DocuSign · 15.4K) |
| AFFiNE | +31.4% (Notion / Miro · 73.3K) |
| Cal.com | +28.0% (Calendly · 48.9K) |
| AppFlowy | +17.2% (Notion · 77.2K) |
| Mattermost | +15.5% (Slack · 39.3K) |
| NocoDB | +12.4% (Airtable · 65.2K) |
Sources: GitHub API; Wayback Machine; host0 count, 8 Oct 2026
The economics#
The case for building rests on one comparison: the seat bill against the cost of building and keeping your own version. Seat bills vary a lot. On list prices billed annually, read on 8 October 2026, ten seats of a horizontal tool like Jira, Calendly, Notion or Slack cost $949 to $2,400 a year; ten seats of a sales or support suite cost $6,600 to $23,400.
What SaaS seats cost a small team
List price per seat per month billed annually, and yearly cost for 10 and 50 seats, US dollars, as shown on 8 Oct 2026
Sources: Atlassian; Calendly; Asana; Slack (Wayback); Linear; Notion; DocuSign (Wayback); Zendesk (Wayback); HubSpot; Salesforce
The build side is mostly people's time. An app builder, a database and hosting together cost about $840 a year at list prices (Lovable Pro, Supabase Pro and Vercel Pro); our token-spending numbers are in AI token spending in 2026. The rest is hours. We priced an hour at $92.06: the BLS median of $64.44 an hour for software developers and testers, divided by the 70% share wages make up of employer costs. Then we tried three maintenance assumptions, from a light one based on the classic finding that maintenance takes about 60% of software costs to SaaStr's experience that each security update cycle "takes us about a week to fully recover from".
When building beats the seat bill (illustrative)
Yearly cost of a built replacement under three maintenance assumptions, and the team size at which it equals the seat bill, our model, Oct 2026 prices
Sources: BLS wages; BLS employer costs; Glass, IEEE Software; SaaStr; Vendor pricing pages; host0 arithmetic
Two things fall out of the table. For cheap horizontal tools, building rarely pays on licence savings alone: a 10-person team pays $949 to $2,400 a year for one, and even scenario B costs $3,540. That's Lemkin's "no economic justification for building these apps based on software cost savings" in numbers. For expensive suites the math flips at a handful of seats, but those are the systems of record, with customer data, permissions and compliance, that even the enthusiasts in our case table chose to keep. And the answer moves twelve-fold between scenarios A and C on one input nobody measures well: how many hours a vibe-coded app needs each year.
That input is where the security work lives. A built tool that holds customer or employee data needs patching, access control and someone on call, and our vibe-coded app security roundup shows what happens when nobody does it.
“SaaS is dead”, and the replies
Dated claims that AI would replace SaaS, the walk-backs and the rebuttals, Aug 2024 to Aug 2026
Aug 2024
12 Dec 2024
12 Dec 2024
Nadella: business logic moves to agents
On the BG2 podcast, Microsoft's CEO described business apps as databases with business logic that agents will take over.2 Feb 2025
2 Feb 2025
3 Mar 2025
3 Mar 2025
Klarna: “we did not replace SaaS with an LLM”
About 1,200 SaaS shut down, by an internal estimate, “not for the license fees”.3 Feb 2026
18 Feb 2026
18 Feb 2026
Lemkin: “no economic justification”
SaaStr replaced a paid tool in a day and a half, and kept maintaining it.25 Feb 2026
1 Jul 2026
1 Jul 2026
Gartner: “SaaS will not be destroyed”
Up to $234B of app spend exposed to agents by 2030, about 20%.27 Jul 2026
6 Aug 2026
6 Aug 2026
Masad: buy-vs-build reasons “going away”
Replit's CEO says Replit cut most of its analytics products.26 Aug 2026
26 Aug 2026
On the same call a customer, Ohalo's David Friedberg, called it a SaaSpocalypse “with a lowercase S” for vertical tools.
Sources: Klarna CEO on X; TechCrunch; Gartner; Salesforce Q2 FY27 transcript
Who wins#
If vibe coding is moving money anywhere, it's toward the infrastructure the agents build on: databases, hosting and the models themselves. The vendors' own numbers say agents are now a large share of their new customers' workloads. They're claims, measured differently and on different dates, so don't line them up as one metric.
Infrastructure that agents build on
>60%
New Supabase databases launched by an AI tool, Jun 2026; launches up 600% in a year
Company claim
Source: Supabase
Investors drew the same line. In Tunguz's grouping, the companies selling the stack grew revenue faster and were rewarded for it; the seat-priced applications grew revenue at 12.5% against 21.4% and lost about a third of their value. The coding agents feeding this are in State of AI coding agents 2026.
Stack vs seats: one-year stock returns
1-year stock return by segment, 87 public software companies, to 30 Jun 2026, %
| Label | Value |
|---|---|
| Infrastructure and dev tools | +68.5% (13 companies; revenue growth 21.4%) |
| Security | +17.6% (8 companies; revenue growth 24.1%) |
| Business applications | −36.2% (48 companies; revenue growth 12.5%) |
Source: Tomasz Tunguz
The incumbents are also absorbing the threat as product. monday.com sells its own vibe-coding tool, Wix bought Base44, and Atlassian says customers who use AI coding tools expand their Jira seats 5% faster. Atlassian's reading: more software built means more work to track.
What this means if you build with AI#
The data says the replacement is real at the edges and small in aggregate. A few practical rules follow from it.
- Replace point tools, keep systems of record. The cases that work are cheap, simple tools that stopped improving: forms, schedulers, admin panels, dashboards, a newsletter sender. CRM, HR, finance and anything with compliance attached is where even the enthusiasts went back to buying.
- Price the upkeep before the build. The build is a day; the maintenance is forever. In our model a $16 seat tool needs 18 users to pay back with two hours of upkeep a month, and 126 with a week of security work every two months. If nobody owns the app, don't replace the subscription.
- Build what doesn't exist to buy. The apps people actually make with AI builders aren't Notion clones. They're the clinic's patient flow, the warehouse's stock sheet, the approval path nobody sells. That's where building wins outright.
- Use the build option as leverage. SaaS prices rose 16.4% a year by June on Vertice's data while portfolios stayed flat. Knowing you could replace a tool is a reason to negotiate the renewal, even if you never do.
- Treat the data as the hard part. A replacement holds the same customer and employee records the vendor did. Plan access control, backups and an export before the first real user, not after.
- Check what's already open source. Many of the tools people want to replace have a maintained self-hosted alternative, and someone else does the security patches.
Most of what replaces SaaS so far is internal tools, and those should open only for the people who use them. host0 is hosting for whatever your agent creates: a link you can share, private by default, and free during the beta.
Methodology#
This post draws on four research passes: public markets and SaaS operating data, build-versus-buy surveys and case studies, the economics of seats against builds, and our own counts. Each was limited to primary sources: company releases, filings and earnings-call transcripts, analyst firms' press releases, survey results pages and vendors' own data posts. We used aggregator and "statistics" sites only as leads. Before publishing we re-opened the pages the post leans on for its headline numbers and confirmed the figures were still there.
Our own numbers, all pulled on 8 October 2026:
- Stock prices: daily adjusted closes from Yahoo Finance's public chart endpoint, 2 January 2024 to 7 October 2026. The SaaS basket is the equal-weight average of each of the nine stocks' price relative to 2 January 2024. Peaks are the highest close since 1 January 2025; troughs the lowest close after the peak. Our daily moves matched press reports on every date we checked.
- Valuation multiples: the median EV / NTM revenue, growth and net retention printed in 146 weekly Clouded Judgement posts, read through Substack's public API; the chart uses the last post of each month.
- GitHub counts: the authenticated search API,
total_countper creation month for"<product> clone" OR "<product> alternative" in:name,description created:<month>for each of 16 B2B and 9 consumer products, withis:publicas the denominator;alternative in:descriptionandtopic:self-hostedthe same way. All 1,239 calls returned complete results. - App sample: 150 random Lovable exports (
"Welcome to your Lovable project" OR "lovable.dev/projects" in:readme), 150 Google AI Studio exports ("Run and deploy your AI Studio app" in:readme) and 100 random new public repos, each drawn by a random creation time weighted by monthly volume; classified by one rater from name, description and the first README lines, with Wilson 95% intervals. - Stars: the GitHub API on 8 October 2026 against the Wayback Machine snapshot of each repo page nearest October 2025.
- Break-even model: list prices read on 8 October 2026, tooling $840 a year, labour at $92.06 an hour (BLS median wage ÷ 0.70), build hours spread over three years; break-even seats = yearly cost ÷ yearly seat price.
We dropped claims that didn't hold up: the "$2 trillion" and "$285 billion in a day" losses that circulate (aggregator figures with no clear definition), a "41% of tech companies" share attributed to McKinsey (it's in an image we couldn't read), Retool's figure framed as "35% of enterprises" (it's 817 builders including its own customers), any dollar saving attached to Klarna's SaaS cuts, a Dario Amodei quote whose source we couldn't re-open, and Gartner predictions we couldn't find on Gartner's site.
Limitations:
- Stock prices aren't verdicts. They price expectations, which moved with interest rates and AI launches as much as with any customer behaviour.
- SaaS-management data is vendors' data. Zylo, BetterCloud, Vertice and Tropic see their own customers and sell spend control.
- Surveys measure intentions. "Decided against buying one or more products or features" has no dollar size.
- GitHub is a floor. Private repos and apps that never leave the builder are invisible; exports may lean toward developers.
- The break-even model is illustrative. The maintenance input has no good measurement for AI-built apps.
Open questions#
- How much revenue the 32% represents. Nobody sizes the purchases that weren't made.
- How many replacements get reversed. We have one public reversal and Gartner's prediction that 60% of vibe-coded apps will be retired by 2028; no survey measures it.
- How much upkeep a vibe-coded app needs. The break-even moves twelve-fold on this input.
- Whether seat counts are falling. No vendor discloses paid seats over time in a comparable way.
- What coding-agent users build. Our sample covers app builders; Claude Code, Cursor and Codex leave no repository-level fingerprint.