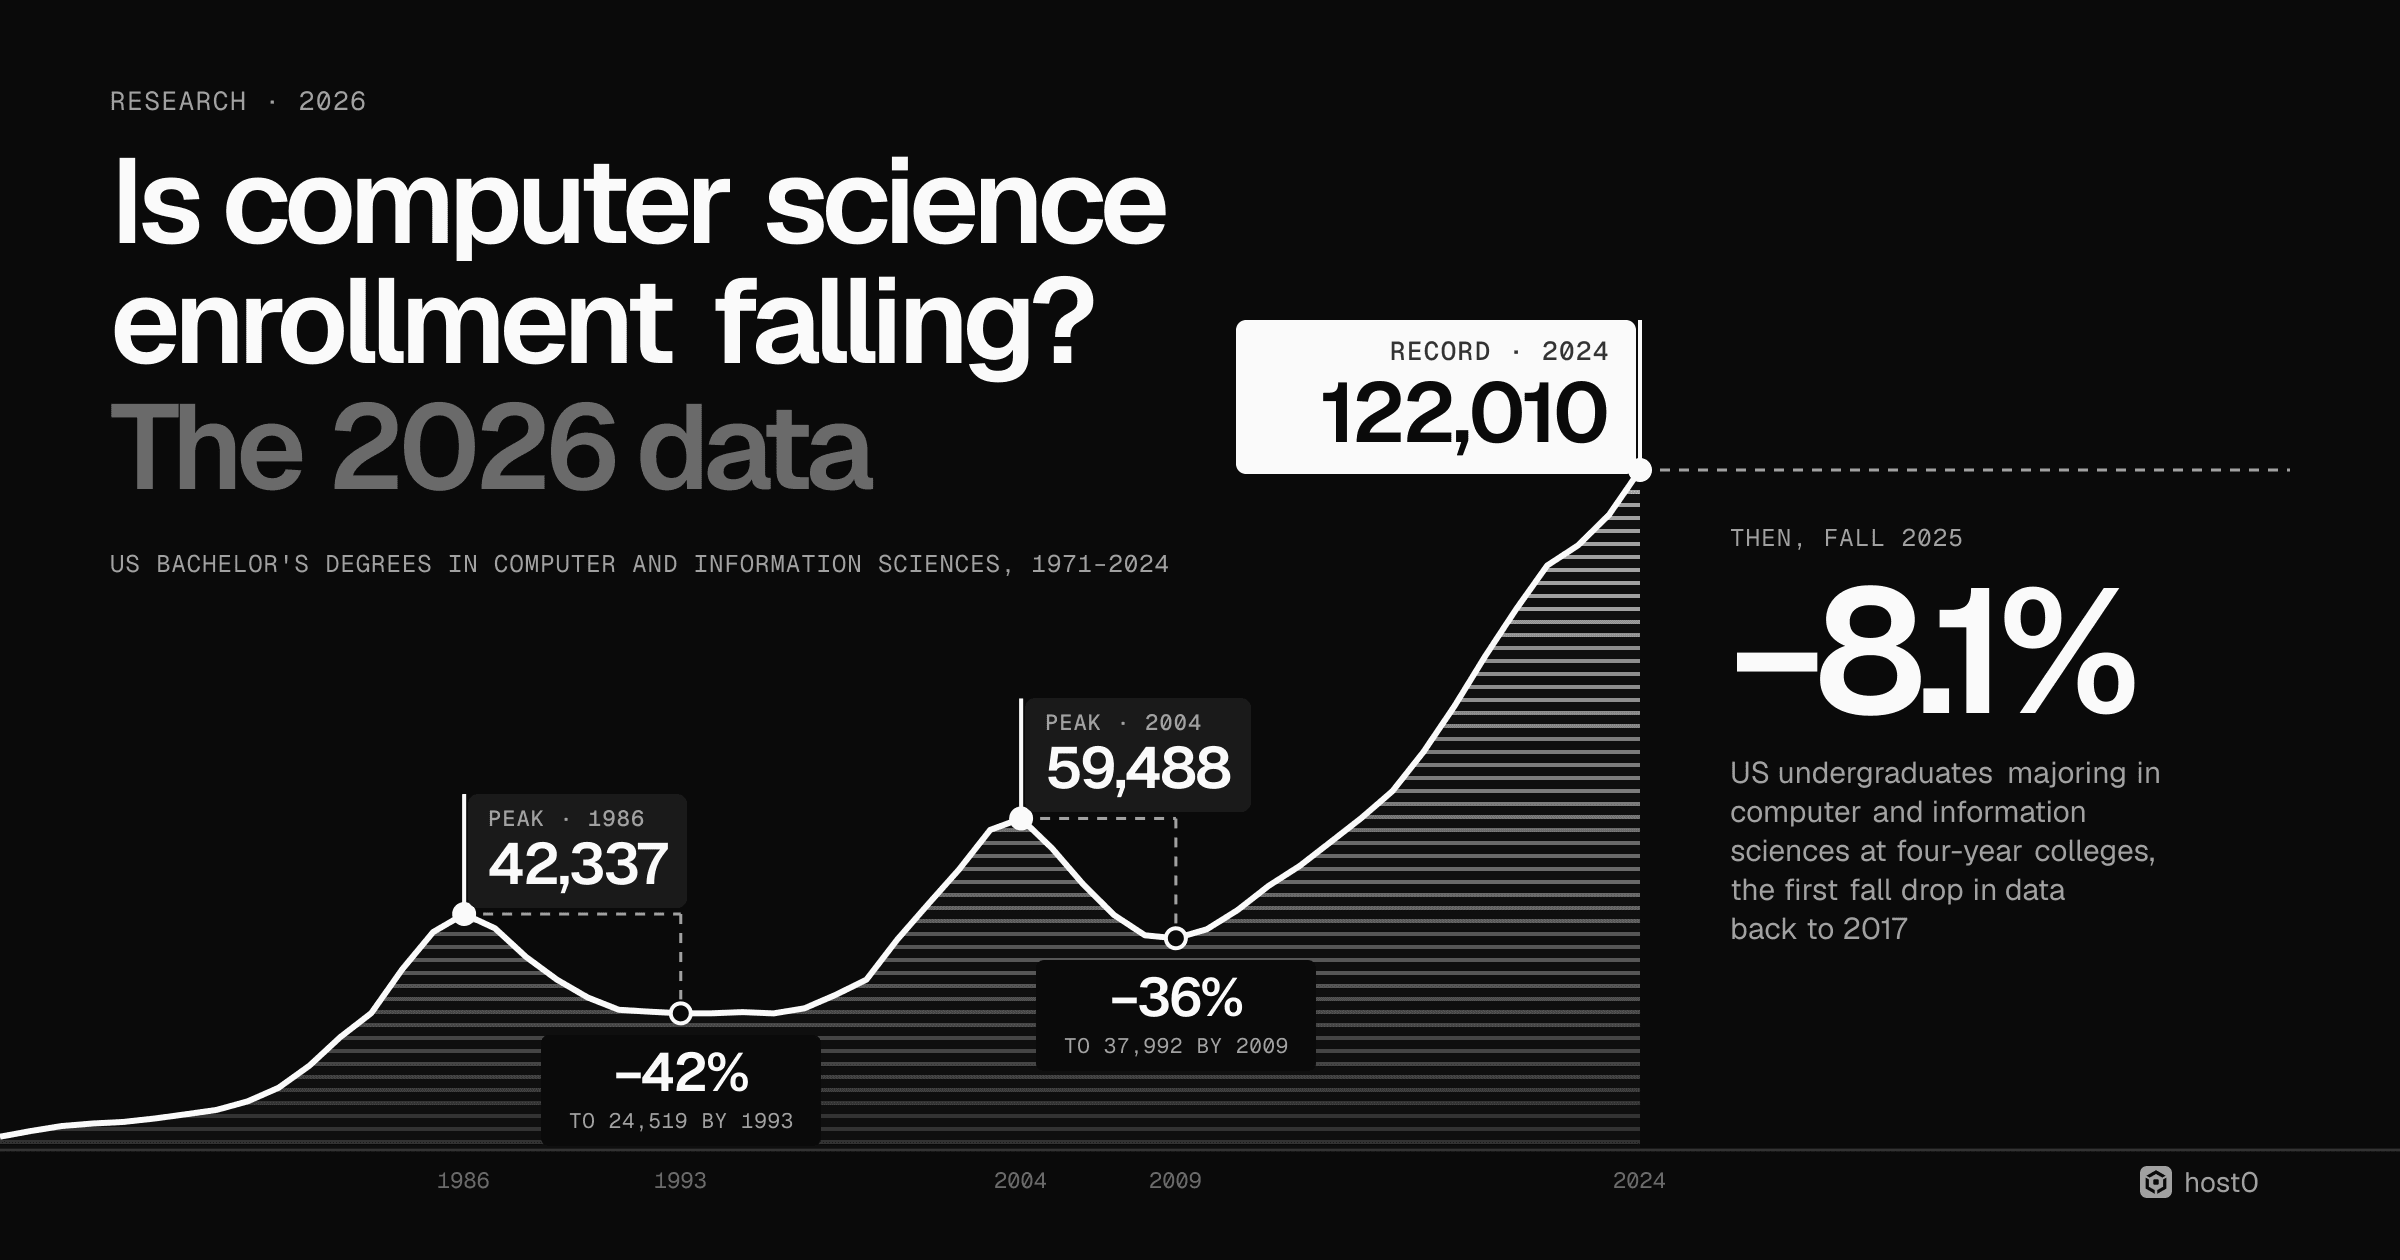
For twenty years computer science was the safest bet in higher education. US colleges awarded twice as many computer and information sciences bachelor's degrees in 2023-24 as in 2014-15, and in the UK and Germany the number of new computing students kept climbing. Then, in fall 2025, the number of undergraduates majoring in computer and information sciences at US four-year colleges fell by 8%, while enrollment across all majors went up. Applications to computing courses in the UK have fallen for two cycles in a row. Bootcamps, the fast route into programming jobs, started closing even earlier.
The data is less dramatic than the headlines, and more interesting. Degree counts are still at records, because they reflect students who started four years ago. The fall shows up first in the numbers that move fastest: applications, new majors, first-year students. At the same time, neighbouring fields such as AI, data science and engineering are growing. We put the public data side by side: the National Student Clearinghouse's enrollment files, the CRA Taulbee survey of computing departments, federal degree counts, AP exam volumes, UCAS, Germany's statistics office and bootcamp operators' filings. Most numbers are computed by us from the raw files; the methodology has the details.
Key findings
- 1The first fall drop in the national data since at least 2017. US undergraduates majoring in computer and information sciences at four-year colleges fell 8.1% in fall 2025, from 659,708 to 606,136, while enrollment across all majors at the same colleges rose 0.3%. It was the biggest drop in students of any major, and the first fall decline in the Clearinghouse's series, which starts in 2017.
- 2Every level fell, graduate programs most. Graduate enrollment in the field fell 14.0%, and about 106,000 fewer students were studying it across all levels. The fall continued in spring 2026: −8.4% at four-year colleges and −11.2% at two-year colleges, while undergraduate enrollment overall grew.
- 3New majors turned first; degrees haven't yet. At PhD-granting computing departments, new computer science majors fell 12.9% in 2025, the same year those departments awarded a record 32,266 bachelor's degrees. Degrees lag the point of entry by about four years.
- 4The pipeline before college is shrinking too. AP Computer Science A exams fell 5.0% in 2025 while AP exams overall grew 7.6%. At the University of Washington, applicants listing computer science or computer engineering as their first-choice major fell 38% in two years, from 8,503 to 5,249.
- 5The UK turned at the same time. Applications to computing courses at the 30 June deadline fell 14.2% between the 2024 and 2026 cycles while applications to all subjects rose 6.5%. Accepted applicants in computing, counted 28 days after results day, fell 13.6%, the biggest fall of 21 subject groups.
- 6In Germany, fewer Germans are starting computer science. First-time students in Informatik fell 2.3% in 2025 (preliminary figures), the first drop since 2020. In the winter semester, German nationals starting the subject fell 8.6% and foreign students rose 8.4%.
- 7Some of it looks like a move within computing. In the UK, accepted applicants for artificial intelligence courses rose 35.6% in 2025 while computer science fell 9.9%. In the US, data science and data analytics majors grew to 35,246 and engineering grew 7.3% in the same fall that computing fell.
- 8Bootcamps contracted first. 2U's boot camp enrollments fell 40% year on year in the second quarter of 2024, "particularly in coding boot camps", and that December it decided to wind them all down. General Assembly stopped taking consumer students in April 2026.
−8.1%
US undergraduates in computer and information sciences at four-year colleges, fall 2025 vs 2024
All majors +0.3%
Source: National Student Clearinghouse
32,266
Computer science bachelor's degrees awarded by the same departments in 2025, a record
Source: CRA Taulbee 2025
−14.2%
UK applications to computing courses at the 30 June deadline, 2024 to 2026 cycle
All subjects +6.5%
Source: UCAS
A boom that doubled the degrees#
Computer science has boomed and busted before. The federal Digest of Education Statistics shows US bachelor's degrees in computer and information sciences peaking at 42,337 in 1985-86 and falling 42% by 1992-93. The next peak came at the end of the dot-com boom, 59,488 in 2003-04, followed by a 36% fall to 37,992 in 2008-09. It took until 2014-15 to get back above that level.
The boom since then has been bigger than both. We counted the degrees in the federal IPEDS completions files: 59,615 in 2014-15 and 122,010 in 2023-24, the latest year published. That's 2.05 times as many, and the field's share of all US bachelor's degrees went from 3.1% to 6.2%. The National Student Clearinghouse, which counts students who earned a degree rather than degrees conferred, has a later year: 137,660 in 2024-25, up 13.8% on a year earlier.
US bachelor's degrees in computer and information sciences
Degrees conferred per academic year, by the year it ends, 1971 to 2024
| x | y |
|---|---|
| 1971 | 2,388 |
| 1976 | 5,652 |
| 1981 | 15,121 |
| 1984 | 32,439 |
| 1986 | 42,337 (peak) |
| 1988 | 34,651 |
| 1990 | 27,347 |
| 1993 | 24,519 |
| 1996 | 24,506 |
| 1998 | 27,829 |
| 2000 | 37,788 |
| 2002 | 50,365 |
| 2004 | 59,488 (dot-com peak) |
| 2006 | 47,702 |
| 2009 | 37,992 |
| 2011 | 43,066 |
| 2013 | 50,961 |
| 2015 | 59,586 |
| 2017 | 71,416 |
| 2019 | 88,638 |
| 2020 | 97,054 |
| 2021 | 104,883 |
| 2022 | 108,503 |
| 2023 | 113,990 |
| 2024 | 122,010 |
Sources: NCES Digest table 325.35; IPEDS completions
Degrees are the end of a four-year pipeline. To see where it's heading, you have to look at the students who are in it now.
Fall 2025: the first drop#
The National Student Clearinghouse collects enrollment records from almost every US college, covering about 97% of students, and publishes them by declared major. In fall 2025, the number of undergraduates majoring in computer and information sciences at four-year colleges fell from 659,708 to 606,136. That's 53,572 fewer students, the biggest drop in students of any major. In percentage terms, three much smaller fields fell faster.
The Clearinghouse's report says enrollment in the field "declined across all award and institution types". Its own series of enrollment by major only goes back to 2017, and this was the first fall it fell. The narrower computer science major fell 11.2%, and computer programming 25.9%.
US undergraduates majoring in computer and information sciences
Fall enrollment at four-year colleges, weighted headcount, 2017 to 2025
| x | y |
|---|---|
| 2017 | 427,222 |
| 2018 | 444,981 |
| 2019 | 470,825 |
| 2020 | 498,977 |
| 2021 | 520,448 |
| 2022 | 574,333 |
| 2023 | 628,519 |
| 2024 | 659,708 (peak) |
| 2025 | 606,136 |
Sources: National Student Clearinghouse, fall 2025 appendix; Fall 2022 appendix
Graduate programs fell hardest. Graduate enrollment in the field dropped 14.0%, from 220,885 to 190,002. Across undergraduate and graduate levels together, about 106,000 fewer students were enrolled than a year earlier, a 9.1% fall. In spring 2026 the decline continued: −8.4% at four-year colleges and −11.2% at two-year colleges, while undergraduate enrollment overall rose 1.3%.
Fall in computer and information sciences enrollment, by level
Change in students majoring in the field, fall 2024 to fall 2025, percent
| Label | Value |
|---|---|
| Graduate | −14.0% |
| Two-year colleges | −8.3% |
| Four-year colleges | −8.1% |
| Primarily associate-degree colleges | −3.6% |
Students who do start are also less likely to stay. Among bachelor's students who started in fall 2024, 85.0% of computer science students were still enrolled in college a year later, the lowest of the ten most popular majors, against 93.1% in engineering. It was the second year in a row that the figure fell.
New majors turned first#
Enrollment counts every student in the major, including those who started years ago. The earlier signal is how many students declare it each year. The CRA Taulbee survey, which covers PhD-granting computing departments in the US and Canada, tracks a fixed group of 83 departments that reported every year since 2020. Their new computer science majors peaked at 23,712 in 2024 and fell 12.9% to 20,664 in 2025. In the report's words, "new majors are the earliest signal of demand, and the signal has turned".
The same departments awarded a record 32,266 computer science bachelor's degrees in 2025, 12.8% more than a year earlier. That isn't a contradiction. "Because degrees lag the point of entry by roughly four years", CRA writes, the record reflects the enrollment surge after the pandemic. It expects degree counts to plateau and then fall.
Computer science students at PhD-granting departments
Index, 2020 = 100, fixed cohort of departments in the US and Canada, 2020 to 2025
| Series | x | y |
|---|---|---|
| Master's enrollment | 2020 | 100 |
| Master's enrollment | 2021 | 103.8 |
| Master's enrollment | 2022 | 134.1 |
| Master's enrollment | 2023 | 159.5 |
| Master's enrollment | 2024 | 159.9 |
| Master's enrollment | 2025 | 117.9 |
| New bachelor's majors | 2020 | 100 |
| New bachelor's majors | 2021 | 111.7 |
| New bachelor's majors | 2022 | 118.1 |
| New bachelor's majors | 2023 | 134.1 |
| New bachelor's majors | 2024 | 136.5 |
| New bachelor's majors | 2025 | 119 |
| All bachelor's majors | 2020 | 100 |
| All bachelor's majors | 2021 | 105.7 |
| All bachelor's majors | 2022 | 115 |
| All bachelor's majors | 2023 | 124.2 |
| All bachelor's majors | 2024 | 133.2 |
| All bachelor's majors | 2025 | 127.7 |
Source: CRA Taulbee Survey 2025
The master's collapse is the sharpest number in the report: total computer science master's enrollment fell from 35,735 to 26,367. Those programs depend on international students, who made up about 53% of master's enrollment, and CRA puts the fall down to "a combination of factors including drastic decline in the new enrollments… and visa/immigration related issues". The bachelor's fall is uneven too. In the chart data, total computer science enrollment at private departments fell 18.5% in 2025, against 1.4% at public ones (our calculation; CRA doesn't state it).
Department heads reported the turn months before the national data. In a CRA pulse survey fielded from late August to mid-September 2025, 62% of the 133 computing departments in the US and Canada that answered reported lower bachelor's enrollment than a year earlier. Among the 75 that gave a size for their decline, it averaged 11–15%, and 23 reported falls of more than 20%. About 46.5% of the departments CRA contacted responded, and some reported estimates because term had barely started.
Before college: AP exams and applications#
The decline starts before students reach college. In May 2025, AP Computer Science A exams fell 5.0%, from 98,136 to 93,217, while the total number of AP exams rose 7.6%, in College Board's volume data. AP Computer Science Principles, the introductory course, was flat. College Board hasn't published 2026 volumes yet.
AP computer science exams taken
Exams per year, worldwide, 2017 to 2025
| Series | x | y |
|---|---|---|
| Computer Science Principles | 2017 | 44,330 |
| Computer Science Principles | 2018 | 72,187 |
| Computer Science Principles | 2019 | 96,105 |
| Computer Science Principles | 2020 | 116,751 |
| Computer Science Principles | 2021 | 116,466 |
| Computer Science Principles | 2022 | 134,651 |
| Computer Science Principles | 2023 | 164,505 |
| Computer Science Principles | 2024 | 175,261 |
| Computer Science Principles | 2025 | 175,174 |
| Computer Science A | 2017 | 60,519 |
| Computer Science A | 2018 | 65,133 |
| Computer Science A | 2019 | 69,685 |
| Computer Science A | 2020 | 70,580 |
| Computer Science A | 2021 | 74,676 |
| Computer Science A | 2022 | 77,753 |
| Computer Science A | 2023 | 94,438 |
| Computer Science A | 2024 | 98,136 |
| Computer Science A | 2025 | 93,217 |
Access to computer science in school is still growing. Code.org's 2025 report says 60% of US public high schools offer a foundational computer science course, up from 57.5% a year earlier. The drop is in students choosing the subject, not in schools offering it.
Applications show it most directly. The University of Washington's Allen School admits most of its students directly from high school, and it publishes how many applicants list computer science or computer engineering as their first-choice major. The number fell from 8,503 to 5,249 between the 2024 and 2026 entry years. Washington residents fell from 2,094 to 1,205, and their admission rate rose from 27% to 41%.
Applicants to the University of Washington's Allen School
Applicants listing computer science or computer engineering as first-choice major, by entry year
| Label | Value |
|---|---|
| 2023 | 8,540 |
| 2024 | 8,503 |
| 2025 | 6,946 (−18%) |
| 2026 | 5,249 (−24%) |
Source: UW Paul G. Allen School
Other universities report the same turn. The University of California had 12,652 undergraduates majoring in computer science in 2025-26, a 6% drop on top of a 3% drop in 2024 and the first decline since the dot-com bust, the San Francisco Chronicle reported; UC San Diego, the only campus with an AI major, was the exception. Using a dataset of more than 50 million course sections at 1,019 US colleges since 1996, Hoover Institution economist Jacob Light found that computer science's share of course enrollment fell in 2025-26 for the first time in about 20 years. Business Insider reported the finding, as summarised by The Next Web in July 2026; we haven't seen the paper. Light called the pattern descriptive, not causal.
Moving within computing, not only leaving#
Part of the fall may be students moving to neighbouring fields, though no national data follows individual students between majors. In the same fall that computer and information sciences lost 53,572 undergraduates at four-year colleges, engineering gained 46,413 (+7.3%). Data science and data analytics, new major codes in 2020, together reached 35,246 students, up 6,459 in a year. Inside the computing family, networking and telecommunications grew 10.1% while computer programming fell 25.9%.
Computer science vs engineering vs all majors
Undergraduates at US four-year colleges, index, fall 2020 = 100, fall 2020 to fall 2025
| Series | x | y |
|---|---|---|
| Computer and information sciences | 2020 | 100 |
| Computer and information sciences | 2021 | 104.3 |
| Computer and information sciences | 2022 | 115.1 |
| Computer and information sciences | 2023 | 126 |
| Computer and information sciences | 2024 | 132.2 |
| Computer and information sciences | 2025 | 121.5 |
| Engineering | 2020 | 100 |
| Engineering | 2021 | 97 |
| Engineering | 2022 | 95.8 |
| Engineering | 2023 | 98.2 |
| Engineering | 2024 | 103.1 |
| Engineering | 2025 | 110.6 |
| All majors | 2020 | 100 |
| All majors | 2021 | 98.4 |
| All majors | 2022 | 97.7 |
| All majors | 2023 | 98.4 |
| All majors | 2024 | 101.7 |
| All majors | 2025 | 102 |
The shift toward AI is clearest in the UK, where UCAS counts accepted applicants by detailed subject. In the 2025 cycle, 19,000 people were accepted onto computer science courses, 9.9% fewer than in 2024. Accepted applicants for artificial intelligence courses rose 35.6%, to 1,580, more than double their 2020 level. AI is still small next to computer science, but it's the part of computing that's growing.
UK accepted applicants in computing, by course
Accepted applicants at the end of the 2025 cycle, with change on 2024
| Label | Value |
|---|---|
| Computer science | 19,000 (−9.9%) |
| Games and animation | 5,770 (−5.3%) |
| Software engineering | 5,435 (−6.7%) |
| Artificial intelligence | 1,580 (+35.6%) |
| Information systems | 1,035 (+19.0%) |
Source: UCAS end of cycle data 2025
Surveys of students point the same way, with a caveat. In a Lumina Foundation and Gallup survey run in October 2025, 16% of US college students aged 18 to 59 said they had already changed their major or field of study because of AI's potential impact, and 42% of bachelor's students said AI had made them think at least a fair amount about it. The respondents came from an opt-in online panel (a nonprobability sample, weighted to national demographics), and Gallup gives no breakdown for computer science.
The UK and Germany turned too#
If the turn were purely American, you'd suspect US causes: visa policy, or the US tech hiring slump. But the UK shows the same timing. Applications to computing courses at the 30 June deadline peaked at 205,410 in the 2024 cycle and fell to 176,300 in 2026, a 14.2% drop, while applications to all subjects rose 6.5%. UCAS's own slides for the 2026 deadline say engineering and technology "has the biggest growth in applications, as computing continues to fall". Applications from students living in England fell 15.6%.
Germany turned in the same year, more mildly. The number of first-time students in Informatik (students in their first semester at a German university) rose from 39,574 in 2020 to 47,228 in 2024, then fell 2.3% to 46,138 in 2025, according to Destatis's preliminary figures. The final figures for the winter semester show who's turning away: German nationals starting the subject fell 8.6%, to 23,103, while foreign students rose 8.4%, to 15,133.
New computing students in the UK and Germany
Index, 2020 = 100, by admissions cycle or academic year, 2019 to 2026
| Series | x | y |
|---|---|---|
| UK applications | 2019 | 97.3 |
| UK applications | 2020 | 100 |
| UK applications | 2021 | 101.2 |
| UK applications | 2022 | 117 |
| UK applications | 2023 | 127.5 |
| UK applications | 2024 | 133.8 |
| UK applications | 2025 | 121.5 |
| UK applications | 2026 | 114.9 |
| Germany first-time students | 2019 | 103.7 |
| Germany first-time students | 2020 | 100 |
| Germany first-time students | 2021 | 101.3 |
| Germany first-time students | 2022 | 103.9 |
| Germany first-time students | 2023 | 112.5 |
| Germany first-time students | 2024 | 119.3 |
| Germany first-time students | 2025 | 116.6 |
| UK accepted applicants | 2019 | 97.2 |
| UK accepted applicants | 2020 | 100 |
| UK accepted applicants | 2021 | 96 |
| UK accepted applicants | 2022 | 106.4 |
| UK accepted applicants | 2023 | 112.3 |
| UK accepted applicants | 2024 | 118.3 |
| UK accepted applicants | 2025 | 109.9 |
| UK accepted applicants | 2026 | 102.2 |
Sources: UCAS 30 June deadline 2026; UCAS daily Clearing analysis 2026; Destatis
Accepted applicants in the UK fell 13.6% between 2024 and 2026, counted 28 days after A-level results day. Across all subjects acceptances rose 4.0%, so no other subject group lost as much ground. Engineering and technology grew 25.5% over the same two years. Universities made it easier to get in: the share of computing applications that received an offer rose from 69.3% in 2023 to 75.5% in 2025.
UK accepted applicants by subject group, 2026 vs 2024
Accepted applicants 28 days after results day, index, 2024 = 100
| Label | Value |
|---|---|
| Computing | 86.4 |
| Languages and area studies | 89.8 |
| Agriculture and food | 92.7 |
| All subjects | 104.0 |
| Law | 113.6 |
| Mathematical sciences | 115.3 |
| Engineering and technology | 125.5 |
Where the data is older, it's still rising#
International comparisons lag. The OECD's latest data, for 2024, still shows growth: across 34 countries with a full series, information and communication technology courses took a mean 7.38% of new tertiary students, up from 5.80% in 2019, and the share rose in 32 of them. In Australia, domestic students starting IT courses rose just 0.3% in 2024, after nearly doubling in ten years; the Department of Education says "IT commencements have slowed". In Canada, students in mathematics and computer science rose 0.9% in 2024/25 after 13.8% the year before, with international students in those fields down 4.6%. None of these series covers the 2025-26 academic year yet.
Bootcamps went first#
Coding bootcamps sold a shorter route into the same jobs, and they felt the downturn earliest. By the time university enrollment turned, the biggest operators were already closing.
How the coding bootcamp market contracted
Filings, closures and exits, 2021 to 2026
May 2021
May 2021
The last market-size study
Course Report projects about 25,000 US and Canadian bootcamp graduates in 2020 in a "$350 million industry". It hasn't published one since.Source: Course Report
6 Mar 2024
6 Mar 2024
2U: boot camp enrollments down 6% in 2023
Full-course-equivalent boot camp enrollments fell 6%, cutting revenue by $13.6 million.Source: 2U 10-K
9 Aug 2024
9 Aug 2024
2U: down 40% year on year
Boot camp revenue fell $25.6 million in the second quarter of 2024 on a 40% fall in full-course-equivalent enrollments, "particularly in coding boot camps".Source: 2U 10-Q
6 Dec 2024
6 Dec 2024
2U exits boot camps
It ran boot camps for more than 50 universities under the edX brand. Its interim chief: intensive boot camp training "no longer aligns with what the market wants and needs". Current cohorts finish.Source: Higher Ed Dive
17 Apr 2025
17 Apr 2025
Turing School announces it will close
The Denver nonprofit school winds down after what its leader called a long period of struggle.Source: BusinessDen
Aug 2025
Aug 2025
Lighthouse Labs files for bankruptcy
The Canadian bootcamp and its new parent Uvaro file about seven months after the acquisition.Source: BetaKit
28 Apr 2026
28 Apr 2026
General Assembly stops consumer enrollment
It ends new consumer enrollments and teaches out current students; its training for teams and enterprises continues.Source: General Assembly
Online learning moved toward AI rather than away from learning. Coursera reported 54.4 million course enrollments in 2025, up 10%, of which 5.0 million were in generative AI courses, up from 3.3 million in 2024 according to its previous annual report. It doesn't break out computer science.
Why students are turning away#
None of these sources can say why on its own. The timing fits several explanations at once. Software job postings fell sharply from 2022, and recent computer science graduates now have one of the highest unemployment rates of any major; we went through that data in Did AI kill the junior developer job? AI coding tools spread through 2025, and headlines about how much code AI writes ran ahead of the measurements, as we found in How much code is written by AI? CRA links the graduate fall partly to visa and immigration problems. And some of the fall is a correction: computer science grew far faster than the student population from 2020 to 2024.
What students say is consistent with all of that, but the surveys are weak.
What surveys say about students and computer science
Surveys of students and departments fielded in 2025, with their limits
- Lumina Foundation and Gallup, October 2025. 16% of enrolled students say they changed major or field because of AI (13% of bachelor's students, 19% of associate students). Opt-in online panel of 2,368 bachelor's and 1,433 associate students, weighted; no computer science breakdown.
- CRA Data Buddies, 2025. 35% of computing bachelor's students are quite or extremely concerned that AI will reduce jobs in their field. Students at participating departments only; the sample size isn't published.
- Handshake, class of 2025. 28% of computer science majors were "very pessimistic" about their careers, up 10 points on the class of 2024. Handshake users, more than 2,800 seniors who chose to answer.
- CRA pulse survey of department heads, fall 2025. 66% agree that last year's graduates are having difficulty finding a job, and 54% that international undergraduate enrollment is down. Department leaders' views; 46.5% response rate.
Source: Each survey, linked in its item
The jobs story and the AI story aren't separate. Students reading about AI writing code and students watching older friends struggle to get hired may reach the same conclusion. The data can't tell us which mattered more, or whether either did.
What this means if you build with AI#
For students:
- A smaller class may be an easier one to get into. The University of Washington's admission rate for in-state computer science applicants went from 27% to 41% in two years, and UK computing offer rates rose to 75.5%. If you want the degree, the competition for a place has eased.
- Graduate four years from now, not today. The record degree counts of 2025 are mostly students who started around 2021, at the height of the boom. The smaller classes starting in 2025 and 2026 will reach the job market around 2029 and 2030, with fewer classmates competing for the same first jobs.
- The growth is next to computer science, not away from it. AI courses in the UK (+35.6%), data science and analytics in the US (35,246 students), networking (+10.1%) and engineering (+7.3%) all grew while computer science fell. Courses that teach you to build with AI belong to the same field.
For universities:
- Plan on the leading indicators. New majors, applications and AP exams turned in 2024–2025; CRA expects degree counts to plateau and then fall as those smaller classes move through. Departments that hired for the 2024 peak will see smaller upper-level classes in a few years. In CRA's data private departments fell furthest (−18.5% in total computer science enrollment in one year).
- Master's programs carry the most risk. Total computer science master's enrollment fell 26.2% in a year at departments where international students are about half of enrollment. Anything that depends on that revenue needs a plan B.
For employers:
- Expect a smaller graduate pipeline later this decade. Fewer students in the major today means fewer computer science graduates later this decade. If you'll need junior developers in 2029, the people who'll fill those jobs are choosing their majors now.
- Recruit from the neighbouring fields. Engineering, data science and AI courses are growing while computer science shrinks. Some of the people who'd once have done a computer science degree may be in those classes.
Students who build things with AI need somewhere to show them. host0 puts whatever your agent made at a link you can share, private until you open it, with a shared database if it needs one.
Methodology#
US enrollment. National Student Clearinghouse Research Center enrollment by major: the Final Fall Enrollment Trends 2025 and Final Spring Enrollment Trends 2026 CIP appendices (weighted headcounts by declared major, CIP 2020 codes; "computer and information sciences" is CIP 11, "computer science" is CIP 11.07). Weighted headcounts count each student once, by declared major; the Clearinghouse covers 97% of enrollments at Title IV degree-granting colleges and weights up for the rest. Fall 2017–2019 come from the Fall 2022 appendix and are spliced on at 2020, where the two vintages differ by 0.2%. "All majors" is the sum of every two-digit family including missing majors. The 106,000 figure sums CIP 11 at the four levels the Clearinghouse reports. Persistence is from the Clearinghouse's August 2026 blog post; degree earners from its April 2026 report.
Departments. CRA Taulbee Survey 2025 (enrollment in fall 2025, degrees in 2024-25), using its longitudinal cohort of 83 bachelor's and 91 master's departments that reported every year 2020–2025. Taulbee covers only PhD-granting computing departments in the US and Canada, so it leaves out most teaching-focused colleges; we read the values from the report's chart data. CRA changed to this cohort method this year, so its numbers aren't comparable with older Taulbee totals. The public/private split is our calculation from the same chart data.
Degrees. NCES Digest table 325.35 (2023 edition, to 2021-22). For 2014-15 to 2023-24 we counted CIP 11 bachelor's degrees (first major) in IPEDS completions files, 50 states and DC; our totals match the Digest within 0.7% (within 0.3% in every year except 2017-18). 2024-25 IPEDS data isn't released.
Pipeline. College Board AP exam volume workbooks (exam counts, including outside the US). Code.org's annual State of computer science reports (state coverage changes from year to year). University of Washington Allen School admissions tables, read from its page on 24 October 2026. University of California figures and Jacob Light's course data are as reported by the San Francisco Chronicle and Business Insider; we didn't see the underlying data.
Other countries. UCAS CSV releases for the 30 June 2026 deadline, 28 days after results day 2026 and the 2025 end of cycle, using UCAS's own "All" rows (UCAS rounds to the nearest 5 or 10). "Computing" is UCAS's subject group CAH11; computer science, software engineering and artificial intelligence are subjects within it (CAH3 level). Applications are choices, up to five per applicant; accepted applicants are people. Destatis Schnellmeldung and Statistischer Bericht workbooks for first-time students (1. Hochschulsemester) in the Studienbereich Informatik, per Studienjahr (a summer semester plus the following winter semester); 2025 is preliminary, and earlier preliminary figures were revised by up to 5%. Australia: Department of Education student statistics, 2024. Canada: Statistics Canada table 37-10-0163-01. OECD: the Education at a Glance dataset of new entrants by field (ISCED-F 06), mean of the 34 countries with every year 2019–2024.
Bootcamps and online. 2U and Coursera figures are from their SEC filings (2U's 40% is full-course-equivalent boot camp enrollments, second quarter of 2024 against the same quarter of 2023); closures from the operators' own pages and the outlets linked. Course Report's figures are self-reported by schools.
Tiers. The data pack marks each number as computed by us from raw data, spot-checked against its primary source, or single-sourced. It lists conflicts between sources, how we resolved them and what we chose not to cite (including a widely shared "−4.6% at the average school" figure and survey claims we couldn't read in the original). The pack is in our repository at docs/research/2026-10-24-cs-enrollment.md, and the CSVs and scripts are in docs/research/2026-10-24-cs-enrollment-data/.
Open questions#
- Fall 2026. The Clearinghouse's preliminary fall 2026 numbers weren't out at the end of October 2026. The University of Washington's 24% fall in applications and the UK's 2026 acceptances suggest the decline continued.
- Switching or leaving? No source follows the same students from computer science into data science, AI or engineering. US data doesn't break out AI majors nationally.
- Who's leaving? US major data has no split between domestic and international students. In Germany the domestic fall is hidden by international growth; is the same true elsewhere?
- Why private departments? Total computer science enrollment at private PhD-granting departments fell 18.5% in a year, against 1.4% at public ones. CRA's own pulse survey found no significant public/private difference in how many departments reported a decline, and there's no national cross-check by sector.
- Bootcamp graduates. Nobody has counted bootcamp graduates per year since 2020.
- The rest of the world. India, China and Korea, where computer science intake is largest, have no comparable recent public series by field.