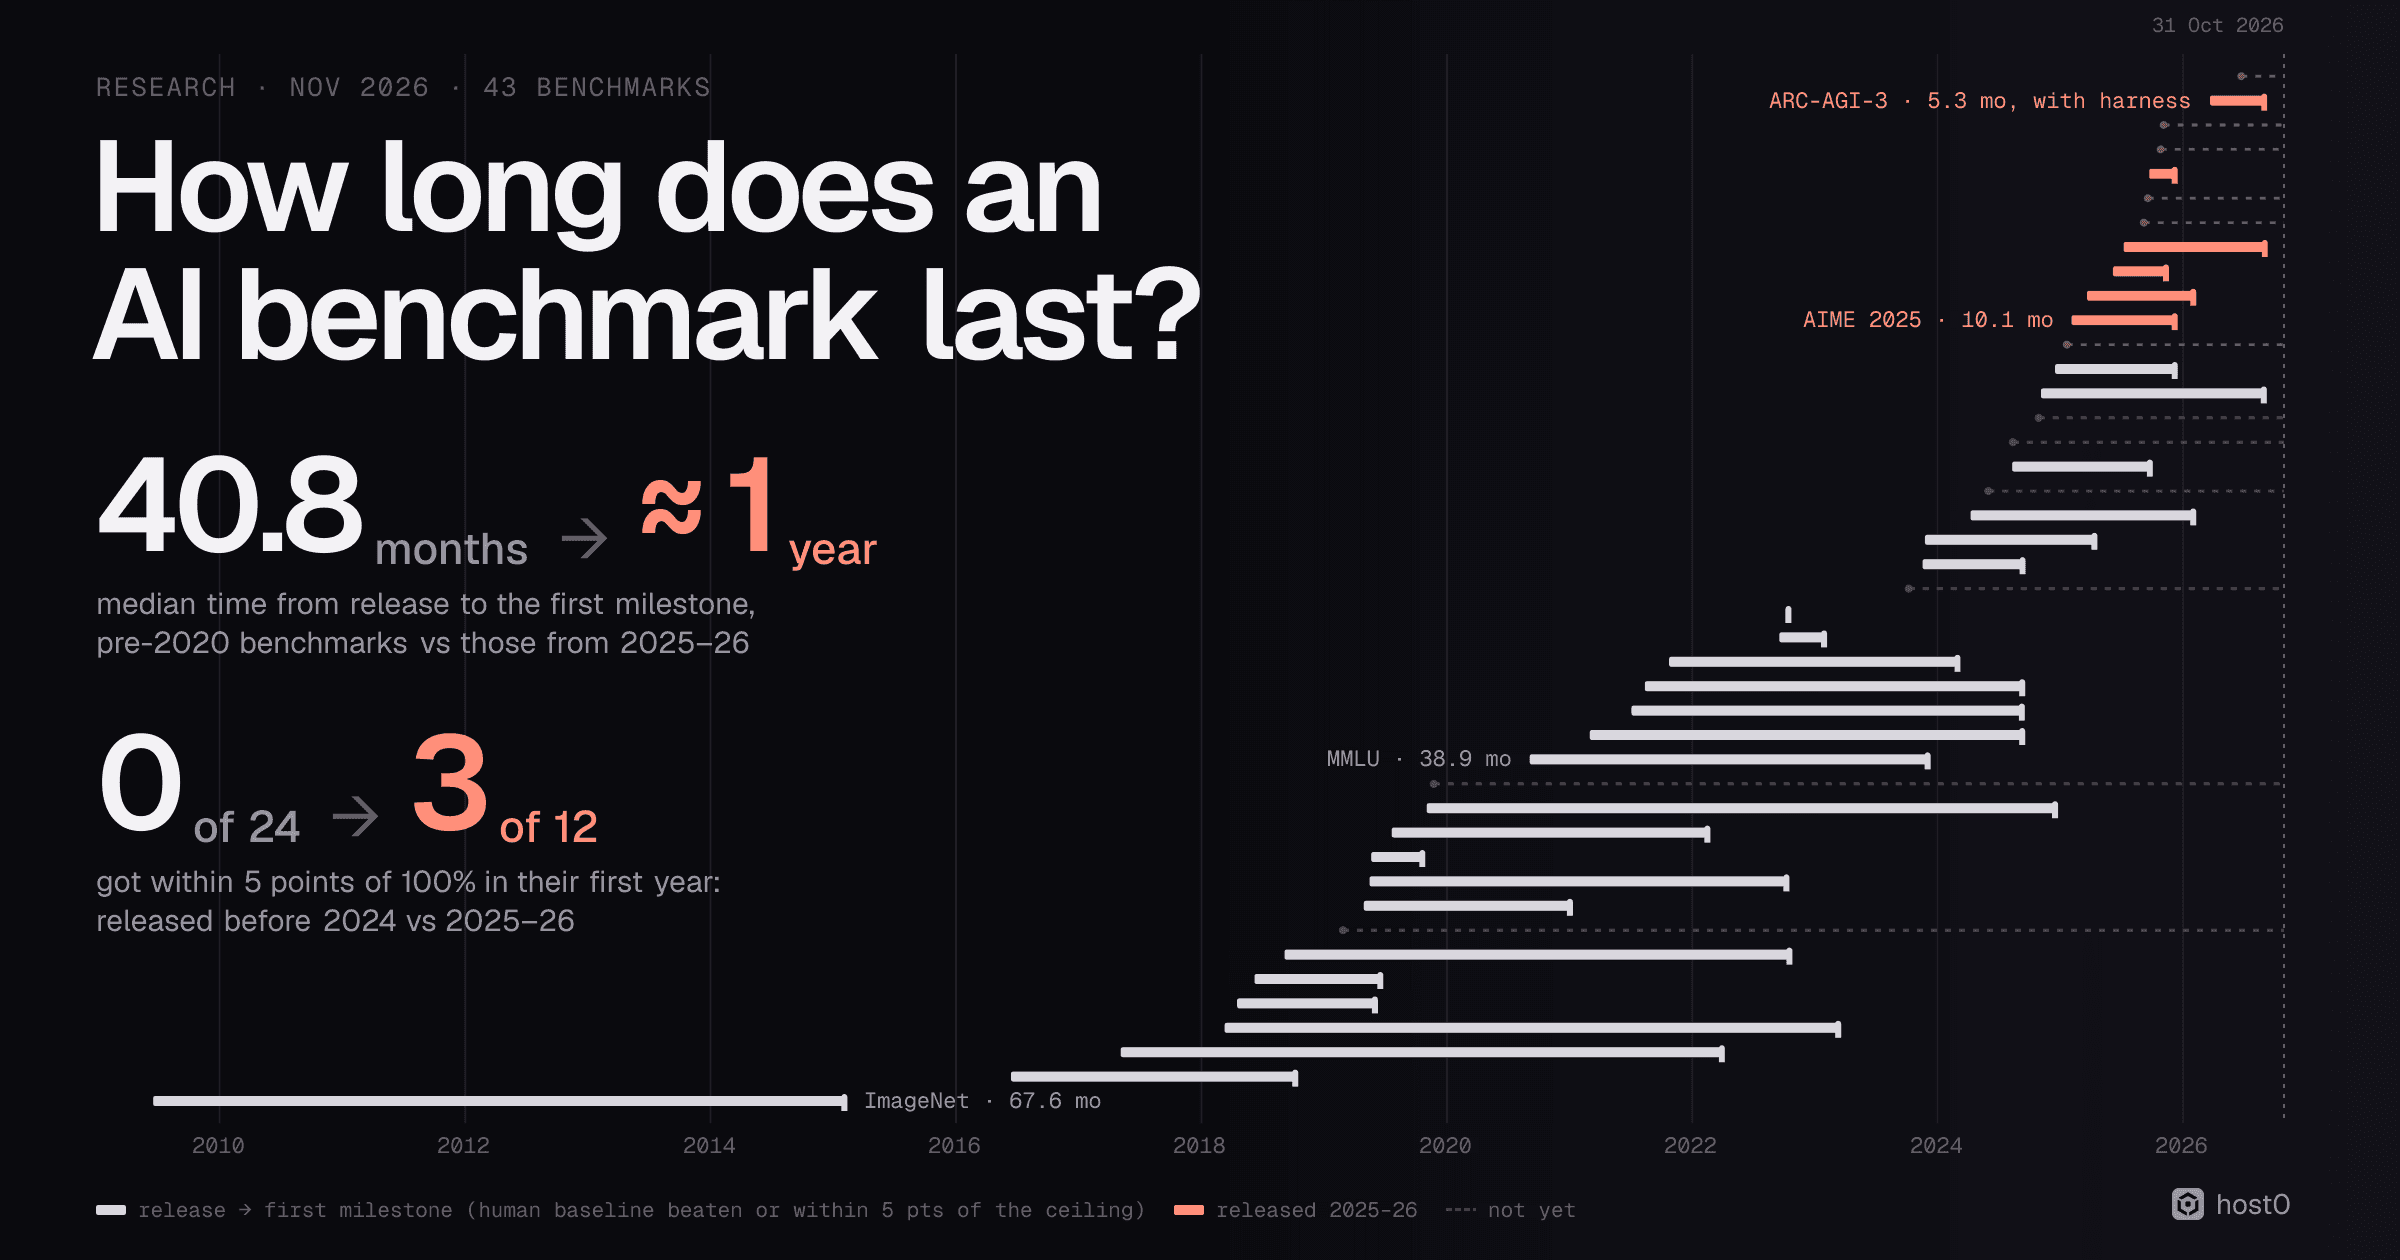
Every model launch comes with a table of benchmark scores, and every table is a little different from the last one. MMLU, the exam that defined "smart" for language models in 2023, hasn't appeared in an OpenAI launch table since September 2024. SWE-bench Verified, which OpenAI built in August 2024, was dropped by OpenAI itself 18 months later. ARC-AGI-3 launched in March 2026 with frontier models under 1%, and by September one system scored 99.95% on it, with a harness that matters a lot (more on that below).
So how long does a benchmark stay useful? We built a dataset to find out. For 43 well-known benchmarks, from ImageNet in 2009 to OSWorld 2.0 in June 2026, we collected 375 record-setting scores from Epoch AI, the last Papers with Code dump, ARC Prize, swebench.com, other leaderboards and labs' own launch tables, and dated each one. Then we measured how long each benchmark took to reach two milestones: beating its published human baseline, or getting within 5 points of a perfect score. We set that next to what happened around the benchmarks: contamination studies, audits of broken questions, labs' launch tables, and the number of new benchmark papers on arXiv. The methodology has the details and the limits.
Key findings
- 1Newer benchmarks fall faster. The median benchmark released before 2020 took 40.8 months to reach its first milestone (beating the human baseline, or getting within 5 points of its ceiling). For benchmarks released in 2025–26 it's about a year, by our count.
- 2Saturation in the first year is new. None of the 24 benchmarks released before 2024 got within 5 points of 100% in its first year. Three of the 12 released in 2025–26 did: τ²-bench telecom, AIME 2025 and ARC-AGI-3, the last only with ARC Prize's provider adapter harness.
- 3Most benchmarks never get to 100%. 27 of the 43 are still more than 5 points short. 14 of those were released before 2024 and stalled between 85% and 95% (SWE-bench's full set at 52.6%), then people stopped reporting them.
- 4They're replaced before they're finished. 13 of the 43 got a direct successor we could date, a median 13.3 months after release. None was within 5 points of 100% when its successor arrived.
- 5The real ceiling is often below 100%. Audits found that at least 6% of ImageNet's validation labels are wrong, an estimated 6.49% of MMLU's questions contain errors, and at least 16.4% of SWE-bench Verified's tasks have flawed tests.
- 6Contamination is now the stated reason to quit. When OpenAI stopped reporting SWE-bench Verified in February 2026, it said every frontier model it tested had seen at least some of the problems and solutions during training.
- 7The scoreboard keeps moving. None of the 7 benchmarks in GPT-4's launch table (March 2023) is in GPT-6 Astra's (September 2026). None of the 10 evaluations in Artificial Analysis's Intelligence Index v4.0 (January 2026) is in v5.0 (October 2026) unchanged.
- 8There are more benchmarks than ever. 4,337 arXiv papers in AI and machine learning had "benchmark" in the title in January to October 2026, 6.3 times as many as in the same months of 2023. Roughly 10 to 13 papers a day introduce a new one.
About a year
Median time from a 2025–26 benchmark's release to its first milestone, against 40.8 months for benchmarks released before 2020
Source: host0 analysis of 43 benchmarks
3 of 12
Benchmarks released in 2025–26 that got within 5 points of 100% in their first year; 0 of 24 released before 2024
Source: host0 analysis
0 of 13
Benchmarks that were within 5 points of 100% when their successor launched, a median 13.3 months after release
Source: host0 analysis
4,337
arXiv papers with 'benchmark' in the title, Jan–Oct 2026, in cs.CL, cs.AI and cs.LG: 6.3× Jan–Oct 2023
Source: host0 count via the arXiv API
Benchmarks reach their milestones sooner#
A benchmark is useful while it separates models. It stops being useful in one of two ways: models beat the people it was meant to compare them with, or scores get so close to the top that the remaining gap is mostly broken questions. We call whichever comes first the benchmark's first milestone. For five benchmarks there's a published estimate of the best achievable score (MMLU's is about 93.5%, because of wrong answer keys), and for those we measure against that estimate instead of 100%.
Benchmarks released recently haven't had long to reach anything, so a plain median of the ones that already did would make them look faster than they are. We use a Kaplan–Meier estimate instead, as in our post on how long AI models live: a benchmark that hasn't reached a milestone by 31 October 2026 counts as "not yet", not as missing.
Months from a benchmark's release to its first milestone
Kaplan–Meier median months, by release year, 43 benchmarks, data to 31 Oct 2026
| Label | Value |
|---|---|
| Before 2020 | 40.8 (n = 14) |
| 2020–22 | 36.9 (n = 7) |
| 2023 | 16.6 (n = 3) |
| 2024 | 21.8 (n = 7) |
| 2025–26 | 13.8 (n = 12) |
Source: host0 analysis of Epoch AI, Papers with Code, ARC Prize, swebench.com and lab launch tables
The direction holds under every cut we tried: drop the benchmarks Epoch AI built itself, count ARC-AGI-3 as unsolved, or ignore the estimated ceilings, and newer benchmarks still reach a milestone sooner. The exact size of the drop for 2024 and 2025–26 doesn't hold, which is why we say "about a year" and not 13.8 months. Another way to see the same change is the share of each group that hit a milestone within a year.
Benchmarks that hit a milestone within 12 months
Kaplan–Meier share reaching the first milestone within a year of release, by release year
| Label | Value |
|---|---|
| Before 2020 | 7% (n = 14) |
| 2020–22 | 29% (n = 7) |
| 2023 | 33% (n = 3) |
| 2024 | 14% (n = 7) |
| 2025–26 | 45% (n = 12) |
Source: host0 analysis
"Human baseline" isn't one thing. GLUE's humans were crowdworkers, GPQA's were PhD experts, MATH's was a 20-problem sample, and on GDPval "human" means parity with expert work (a 50% win-or-tie rate). Beating one of those is a different feat from beating another. The tighter test is the second milestone: within 5 points of 100%.
Months from release to within 5 points of 100%
The 16 of 43 benchmarks whose best score got within 5 points of a perfect score, data to 31 Oct 2026
| Label | Value |
|---|---|
| τ²-bench telecom | 5.2 mo (2025) |
| ARC-AGI-3 | 5.3 mo (2026, adapter harness) |
| AIME 2025 | 10.1 mo (2025) |
| OTIS Mock AIME (Epoch) | 11.7 mo (2024) |
| FrontierMath Tier 4 | 13.8 mo (2025) |
| ARC-AGI-2 | 17.3 mo (2025) |
| GSM8K | 28.2 mo (2021) |
| WinoGrande | 30.9 mo (2019) |
| GPQA Diamond | 33.4 mo (2023) |
| SQuAD 1.1 | 36.1 mo (2016) |
| MBPP | 36.9 mo (2021) |
| HumanEval | 38.2 mo (2021) |
| HellaSwag | 40.8 mo (2019) |
| MATH | 46.9 mo (2021) |
| ARC-Challenge | 60 mo (2018) |
| ARC-AGI-1 | 75.3 mo (2019) |
Source: host0 analysis
The fastest fall in the set is ARC-AGI-3. It launched on 25 March 2026, with frontier models under 1%. On ARC Prize's leaderboard, GPT-6 Astra scored 99.95% on 2 September, 5.3 months later. That run used ARC Prize's "provider adapter harness"; the standard run of the same model scored 62.7%. Either way it's fast, but the harness is the difference between "solved" and "well short".
FrontierMath Tier 4 is a cleaner example. On Epoch AI's runs, OpenAI's o3-mini (January 2025) scored 0%, GPT-6 Astra scored 97.6% in September 2026, and GPT-6.1 Sol scored 100% at the end of that month. Here is that climb next to MMLU and GPQA Diamond, measured from each benchmark's release.
Best score by months since the benchmark's release
Record-setting scores, percent, MMLU (2020), GPQA Diamond (2023) and FrontierMath Tier 4 (2025)
| Series | x | y |
|---|---|---|
| MMLU | 10.9 | 25.7% |
| MMLU | 15 | 60% |
| MMLU | 18.2 | 70% |
| MMLU | 30.2 | 86.4% |
| MMLU | 38.9 | 90% |
| MMLU | 45.4 | 90.4% |
| MMLU | 48.2 | 92.3% |
| GPQA Diamond | 3.3 | 47.2% |
| GPQA Diamond | 7 | 59.4% |
| GPQA Diamond | 9.8 | 77.3% |
| GPQA Diamond | 16.1 | 83.8% |
| GPQA Diamond | 19.6 | 87% |
| GPQA Diamond | 20.6 | 88.4% |
| GPQA Diamond | 24 | 93.8% |
| GPQA Diamond | 27 | 94.4% |
| GPQA Diamond | 32.8 | 94.8% |
| GPQA Diamond | 33.4 | 95.4% |
| GPQA Diamond | 34.3 | 96.4% |
| FrontierMath Tier 4 | 0.9 | 22% |
| FrontierMath Tier 4 | 5 | 46% |
| FrontierMath Tier 4 | 7.8 | 58.5% |
| FrontierMath Tier 4 | 9.4 | 78.1% |
| FrontierMath Tier 4 | 10.9 | 90.2% |
| FrontierMath Tier 4 | 13.8 | 97.6% |
| FrontierMath Tier 4 | 14.6 | 100% |
Sources: Epoch AI Benchmarking Hub; lab launch tables; host0 analysis
Most benchmarks never reach 100%#
Fast saturation is the story people tell. The data shows something else for most benchmarks: they stop short. Of the 43 in our set, 27 are still more than 5 points below a perfect score. 13 of those were released in 2024–26 and are still being climbed. The other 14 are older, and they stalled.
Where the older benchmarks stopped
Best score we hold, percent, for the 14 benchmarks released before 2024 that never got within 5 points of 100%
| Label | Value |
|---|---|
| ScienceQA | 94.9% (Nov 2023) |
| OpenBookQA | 94.4% (Oct 2022) |
| BIG-Bench Hard | 93.1% (Jun 2024) |
| SQuAD 2.0 | 93% (Jan 2020) |
| BoolQ | 92.4% (Feb 2022) |
| MMLU | 92.3% (Sep 2024) |
| ImageNet (top-1) | 91% (May 2022) |
| SuperGLUE | 90.3% (Jan 2021) |
| PIQA | 90.1% (Mar 2021) |
| DROP | 88.4% (Sep 2020) |
| GLUE | 87.6% (Jun 2019) |
| TriviaQA | 87.6% (Jul 2023) |
| MMMU | 85.4% (Nov 2025) |
| SWE-bench (full) | 52.6% (Dec 2025) |
Source: host0 analysis of Papers with Code, Epoch AI and lab tables
MMLU is the clearest case. Google's Gemini Ultra passed MMLU's human-expert estimate of 89.8% in December 2023, which Google called "the first model to achieve human-expert performance" on it. The best verified score we found is 92.3%, by OpenAI's o1-preview in September 2024. Nobody reported 95%. Labs moved to MMLU-Pro and multilingual versions instead.
Part of the reason is that the top of many benchmarks is broken. When researchers audit a benchmark, they keep finding questions with wrong answer keys, ambiguous wording or tests that reject correct answers. A model can't score above the share of questions that are answerable, unless it has memorised the wrong keys.
How much of a benchmark is broken, by audit
Share of items each audit found wrong, flawed or invalid, percent (different methods, see notes)
| Label | Value |
|---|---|
| ImageNet validation set | ≥6% (label errors, 2021) |
| MMLU | 6.5% (errors, 2024) |
| GPQA Diamond | 8% (invalid, Epoch est., 2025) |
| SWE-bench Verified | ≥16.4% (flawed tests, 2026) |
| Humanity's Last Exam, bio/chem | 29% (wrong answers, 2025) |
| Terminal-Bench 2.0 | 31% (28 of 89 fixed, 2026) |
Sources: Northcutt et al.; MMLU-Redux; Epoch AI; Epoch AI review; FutureHouse; Terminal-Bench
SWE-bench Verified shows how this ends. In February 2026 OpenAI audited 27.6% of its 500 tasks, the hardest ones, and found that at least 59.4% of those had tests that reject working fixes, according to Epoch AI's review. That's at least 16.4% of the whole benchmark, so the best honest score is at most about 83.6%. When OpenAI stopped, the best score was 80.9%, by its count. On Epoch's own runs, Claude Opus 4.7 later scored 83.5%. The benchmark had come within 5 points of its real ceiling 13.5 months after launch, without anyone coming near 100%.
The other side is just as telling. Epoch estimated in May 2025 that about 8% of GPQA Diamond's questions are invalid, which would put its ceiling near 92%. The best score on Epoch's runs is now 96.4%. Either the estimate was too pessimistic, or some models are answering broken questions "correctly", which is what you'd expect if they had seen the answer key.
Contamination and gaming#
A public benchmark is a set of questions and answers on the internet, and models are trained on the internet. The longer a benchmark has been public, the more chances it has had to leak into training data, as text, as discussion or as solutions on GitHub.
- When Scale AI wrote 1,000 new grade-school maths problems in the style of GSM8K, called GSM1k, some models did worse on the new ones: accuracy drops of up to 8%, with "several families of models showing evidence of systematic overfitting". Frontier models showed little sign of it.
- On SWE-bench Verified, models named the file with the bug from the issue text alone up to 76% of the time, against up to 53% on repositories outside the benchmark.
- On the original SWE-bench, 32.67% of one agent's successful patches had the solution in the issue or its comments, and another 31.08% passed only because the tests were weak.
- On Chatbot Arena, researchers counted 27 private variants that Meta tested before releasing Llama 4, and estimated that Google and OpenAI had each received about a fifth of all Arena data.
Funding is part of the picture too. OpenAI commissioned Epoch AI to write 300 FrontierMath problems and has access to most of them, apart from a holdout set, a fact Epoch needed OpenAI's permission to disclose and made public only when o3 was announced. Epoch's later run of the released o3 scored about 10%, against the roughly 25% OpenAI announced; Epoch put the gap down to different compute and a different problem set. That isn't evidence of cheating. It shows that "who made the test, and who has seen it" belongs next to every score.
The life of SWE-bench Verified
13 Aug 2024
13 Aug 2024
OpenAI releases SWE-bench Verified
500 human-screened tasks from the original SWE-bench.22 Oct 2024
22 Oct 2024
Claude 3.5 Sonnet (new) scores 49.0%
A leaderboard agent had scored 40.6% a week after release.14 Jun 2025
14 Jun 2025
Models find the buggy file from the issue text alone up to 76% of the time.21 Sep 2025
21 Sep 2025
Scale AI releases SWE-bench Pro
Its successor, built to resist contamination. Verified's best score: 76.8%.28 Sep 2025
28 Sep 2025
Within 5 points of its real ceiling
78.8% by a leaderboard system, 13.5 months after release.23 Feb 2026
23 Feb 2026
Best score 80.9% by OpenAI's count, up from 74.9% six months earlier.16 Apr 2026
16 Apr 2026
Claude Opus 4.7 scores 83.5% on Epoch's runs
Against an estimated ceiling of at most about 83.6%.3 Sep 2026
3 Sep 2026
Sep–Oct 2026
Sep–Oct 2026
Gone from Anthropic's system cards
Not mentioned in any of the four cards published in those months.
Source: OpenAI, Epoch AI, swebench.com, Anthropic system cards; host0 analysis
OpenAI's reason for stopping was contamination, not only bad tests. It wrote that it had stopped reporting SWE-bench Verified scores and recommended that other model developers do so too. Every frontier model it tested had "seen at least some of the problems and solutions during training", in Epoch's summary of the post, so the scores increasingly reflected exposure at training time rather than real software skill. This was OpenAI's own benchmark, 559 days after it launched it.
Successors arrive before saturation#
Benchmark makers don't wait for 100%. Of the 43 benchmarks, 13 got a direct successor with a release date we could pin down, usually from the same team: GLUE became SuperGLUE, SWE-bench became Verified and then Pro, ARC-AGI went to versions 2 and 3, Terminal-Bench to 3.0 and 4.0. The median gap was 13.3 months, and not one of the 13 was within 5 points of 100% when it was replaced.
Best score when the successor launched
Best score we hold on each benchmark on its successor's release date, percent; notes give months from release to successor
| Label | Value |
|---|---|
| BIG-Bench Hard → Extra Hard | 93.1% (28.4 mo) |
| ImageNet → ReaL / V2 era | 90.2% (131.7 mo) |
| MMLU → MMLU-Pro | 90% (44.8 mo) |
| SQuAD 1.1 → SQuAD 2.0 | 88.5% (23.8 mo) |
| Terminal-Bench 2.0 → 3.0 | 84.7% (8.7 mo) |
| ARC-AGI-2 → ARC-AGI-3 | 84.6% (12.0 mo) |
| OSWorld → OSWorld 2.0 | 78.7% (26.5 mo) |
| SWE-bench Verified → Pro | 76.8% (13.3 mo) |
| ARC-AGI-1 → ARC-AGI-2 | 75.7% (64.6 mo) |
| GLUE → SuperGLUE | 70% (12.4 mo) |
| MMMU → MMMU-Pro | 69.1% (9.3 mo) |
| FrontierMath Tiers 1–3 → Tier 4 | 36.1% (8.1 mo) |
| SWE-bench → SWE-bench Verified | 19.8% (10.1 mo) |
Source: host0 analysis; successor release dates from arXiv and the benchmarks' own announcements
The successors' papers say why. SuperGLUE was built because GLUE's scores had "surpassed the level of non-expert humans, suggesting limited headroom". ARC Prize said ARC-AGI-1 "saturated well before it could capture the full spectrum of human fluid intelligence". Terminal-Bench 3.0 exists because "many Terminal-Bench tasks have become saturated", with leaderboard entries squeezed into a narrow range. Terminal-Bench alone went through 1.0, 2.0, 2.1, 3.0 and 4.0 in 15 months, and the best models scored about 34% on 3.0 at launch.
A systematic study of 60 language-model benchmarks, published at ICML 2026, found that "nearly half of our benchmarks exhibit saturation, with rates increasing with age". It also found that resistance to saturation comes from expert curation, "not by public test data". Keeping the test secret mattered less than having experts write it.
A moving target#
If benchmarks are replaced every year or so, the tables that report them change just as fast. We read the results tables of eight OpenAI launches, from GPT-4 to GPT-6 Astra, and counted how many benchmark families each one kept from the launch before.
Benchmarks OpenAI kept from its previous launch
Share of the previous launch table's benchmarks still reported, percent, Sep 2024 to Sep 2026
| Label | Value |
|---|---|
| o1 | 14% (1 of 7) |
| o3 / o4-mini | 71% (5 of 7) |
| GPT-5 | 64% (9 of 14) |
| GPT-5.2 | 62% (10 of 16) |
| GPT-5.4 | 65% (15 of 23) |
| GPT-5.5 | 90% (19 of 21) |
| GPT-6 Astra | 36% (8 of 22) |
Source: host0 analysis of OpenAI launch pages (Wayback captures)
Anthropic's system cards show the same shift in words. We searched all 22 cards Anthropic has published since Claude 2 for "saturat" (saturated, saturation). It doesn't appear in any of the four cards from 2023 and 2024, and it appears at least once in every one of the 18 since February 2025. The Claude Opus 4.6 card (February 2026) uses it 19 times, including "Claude Opus 4.6 has saturated all of our current cyber evaluations". The Opus 4.8 card removed Cybench because it "was largely saturated and therefore less useful".
Mentions of "saturat*" in Anthropic's system cards
Total mentions across each year's cards, 2023 to Oct 2026
| Label | Value |
|---|---|
| 2023 | 0 (1 card) |
| 2024 | 0 (3 cards) |
| 2025 | 31 (6 cards) |
| 2026 | 93 (12 cards, to Oct) |
Sources: Anthropic system cards; host0 analysis
Independent indexes churn too. Artificial Analysis, whose Intelligence Index is the score many people quote to compare models, changed the index's make-up eight times between August 2025 and October 2026. Version 4.0 came out in January 2026 with 10 evaluations. Version 5.0, in October, has none of them unchanged.
Artificial Analysis Intelligence Index: v4.0's evaluations in v5.0
The 10 evaluations in v4.0 (Jan 2026) and what happened to them by v5.0 (Oct 2026)
- Revised (3): AA-Omniscience (v1.1), CritPt (v2, hard subset), Humanity's Last Exam (HLE-Diamond)
- Replaced (2): Terminal-Bench Hard (by 2.1, then 4.0), τ²-Bench Telecom (by τ³-Banking, then AutomationBench)
- Removed (5): IFBench (v4.1), GPQA Diamond (v4.2), GDPval-AA, SciCode and AA-LCR (all v5.0)
More benchmarks than ever#
The supply of new benchmarks has grown even faster than the turnover. We counted arXiv papers in the three main AI and machine-learning categories (cs.CL, cs.AI and cs.LG) with "benchmark", "benchmarks" or "benchmarking" in the title, using the arXiv API and each paper's first submission date.
arXiv papers with "benchmark" in the title
Papers first submitted January to October of each year, cs.CL, cs.AI and cs.LG, 2018 to 2026
| Label | Value |
|---|---|
| 2018 | 51 |
| 2019 | 105 |
| 2020 | 189 |
| 2021 | 298 |
| 2022 | 375 |
| 2023 | 692 |
| 2024 | 1,368 |
| 2025 | 2,437 |
| 2026 | 4,337 |
Source: host0 count via the arXiv API
Not every one of those papers introduces a benchmark: some benchmark existing models, some survey the field. We read 100 random 2026 papers whose title has "benchmark" and whose abstract says "we introduce", "present" or "propose", and 87 of them introduce a new benchmark, dataset or environment. Adding papers with "-Bench" names that the word count misses, our estimate is roughly 3,000 to 4,000 papers introducing a benchmark in the first ten months of 2026: 10 to 13 a day. The counts spike at conference deadlines, with 610 titled papers in May 2026 alone, around the NeurIPS deadline.
So the field isn't short of tests. What it is short of is tests that stay meaningful for long, are run the same way for every model, and haven't leaked.
What lasts longer#
Some measurements are built not to saturate, because they have no top.
Task length. METR measures the length of task, in human working time, that a model completes half the time. On METR's data, the frontier went from 4 minutes with GPT-4 (March 2023) to about 12 hours with Claude Opus 4.6 (February 2026), doubling roughly every 4.2 months since 2023.
How long a task the best model can do
METR 50% time horizon, minutes of human working time, record-setting models, log scale, Mar 2023 to Apr 2026
| x | y |
|---|---|
| 14 Mar 2023 | 4 min (4 min · GPT-4) |
| 13 May 2024 | 7 min |
| 20 Jun 2024 | 11 min |
| 12 Sep 2024 | 20 min |
| 22 Oct 2024 | 21 min |
| 5 Dec 2024 | 39 min |
| 24 Feb 2025 | 60 min |
| 16 Apr 2025 | 120 min |
| 7 Aug 2025 | 203 min |
| 18 Nov 2025 | 224 min |
| 24 Nov 2025 | 293 min |
| 11 Dec 2025 | 352 min |
| 5 Feb 2026 | 719 min (12 h · Opus 4.6) |
| 7 Apr 2026 | 1,045 min (17.4 h · Mythos Preview) |
Source: METR, Time Horizon 1.1 data
This line has a ceiling of its own. METR's time-horizon page says "measurements above 16 hrs are unreliable with our current task suite", and that the page "is no longer actively updated". The last model was added in May 2026. Even an open-ended metric needs harder tasks to keep measuring.
Cost. A score that is also a price keeps its meaning after the score tops out. ARC Prize publishes the cost per task of every entry on its leaderboard. The first system to reach 75% on ARC-AGI-1, the o3 preview in December 2024, cost about $200 per task. In July 2026 DeepSeek V4 Flash scored 84.0% for $0.0118 a task, about 17,000 times cheaper.
Cheapest cost per task to reach a score on ARC-AGI
US dollars per task, cheapest entry released by each quarter's end, log scale, Dec 2024 to Oct 2026
| Series | x | y |
|---|---|---|
| ARC-AGI-1, 75% or more | 31 Dec 2024 | $200 ($200 · o3 preview) |
| ARC-AGI-1, 75% or more | 31 Mar 2025 | $200 |
| ARC-AGI-1, 75% or more | 30 Jun 2025 | $200 |
| ARC-AGI-1, 75% or more | 30 Sep 2025 | $2.56 |
| ARC-AGI-1, 75% or more | 31 Dec 2025 | $0.174 |
| ARC-AGI-1, 75% or more | 31 Mar 2026 | $0.174 |
| ARC-AGI-1, 75% or more | 30 Jun 2026 | $0.174 |
| ARC-AGI-1, 75% or more | 30 Sep 2026 | $0.0118 |
| ARC-AGI-1, 75% or more | 31 Oct 2026 | $0.0118 |
| ARC-AGI-2, 50% or more | 31 Dec 2025 | $1.9 |
| ARC-AGI-2, 50% or more | 31 Mar 2026 | $0.68 |
| ARC-AGI-2, 50% or more | 30 Jun 2026 | $0.68 |
| ARC-AGI-2, 50% or more | 30 Sep 2026 | $0.0416 |
| ARC-AGI-2, 50% or more | 31 Oct 2026 | $0.0416 |
Source: ARC Prize leaderboard data
Stitched indexes and relative ratings. Epoch AI's Capabilities Index combines more than 50 benchmarks on one scale by linking them where models overlap, so it keeps going as single benchmarks saturate; its frontier rose from 125.7 (GPT-4) to 169.1 (GPT-6 Astra) on Epoch's data. Arena-style ratings have no ceiling at all because they're relative, but they have their own problem: the Leaderboard Illusion paper showed how much private testing and data access can lift a model's standing.
What this means if you build with AI#
- Check the age of every benchmark in a launch table. A score on something released this year says more than a score on something from 2021. If a benchmark has been public for two or three years, assume some of it is in the training data.
- Ignore small gaps near the top. Between 85% and 95%, many benchmarks are mostly measuring their own broken questions. A one-point lead on SWE-bench Verified, with at least 16% of its tasks flawed, tells you very little.
- Ask who ran it, and how. Lab-reported scores, independent runs and leaderboard systems differ. Epoch's runs are often below developers' claims, and ARC-AGI-3 is 99.95% or 62.7% depending on the harness. Settings like "max effort", tools, scaffolds and pass@k change the number.
- Watch what disappears. When a lab stops reporting a benchmark it used to lead with, that's information. MMLU, GSM8K and HumanEval left the tables when they stopped separating models; SWE-bench Verified left when its maker said it was contaminated.
- Prefer evals that are hard to game. Private or held-out test sets (SWE-bench Pro's commercial set, ARC Prize's semi-private set), expert-written questions, scores reported with cost per task, and task-length measures like METR's hold their meaning longer than a public multiple-choice exam.
- Test on your own tasks. Collect 20 to 50 real examples from your app, with what a good answer looks like, keep them private, and run them on every model you consider. Re-run them when you switch models, which you will: the median AI model is retired after about 18 months.
- Score cost and speed, not only accuracy. For most apps the question isn't which model is best, but which is good enough at the lowest price and latency. ARC-AGI-1 at 75% got 17,000 times cheaper in 19 months.
If your agent builds you a small eval dashboard, host0 can put it at a private link your team can open, with a shared database for the results.
Methodology#
We used public data only, collected up to 1 November 2026, with a data cutoff of 31 October 2026. Before writing we re-read the primary pages for the audit, contamination, Artificial Analysis, METR and Terminal-Bench figures.
- Benchmarks. 43 well-known benchmarks released from 2009 to 2026, grouped by release year: before 2020 (14), 2020–22 (7), 2023 (3), 2024 (7), 2025–26 (12). Release is the arXiv v1 date of the paper that introduced the benchmark, or its public announcement when there's no paper. The set is famous benchmarks, not all benchmarks, and some recent ones are famous because they fell fast or haven't fallen.
- Scores. 5,843 scores from Epoch AI's benchmarking hub, the last Papers with Code dump (July 2025), ARC Prize's and swebench.com's leaderboard data, other public leaderboards, and labs' papers, model cards and launch pages; 88 points were read by hand. A record is a score that beats every earlier-dated one, dated by the release of the model that set it (or the paper's arXiv v1 date, or the leaderboard submission date). 375 records remain (6 of them ImageNet's top-5 series, used for its human baseline). Systems count: ensembles, fine-tuned models, agent scaffolds and refinement harnesses are in, as each source reported them.
- Milestones. "Human baseline beaten" is the first record at or above the published human figure; 24 of the 43 benchmarks publish one, and they range from crowdworkers to PhD experts. "Saturated" is the first record within 5 points of 100%, or of a published ceiling estimate where one exists (ImageNet, MMLU, GPQA Diamond, SWE-bench Verified, FrontierMath Tiers 1–3). The first milestone is whichever came first. Medians are Kaplan–Meier estimates, with benchmarks that hadn't reached a milestone by 31 October 2026 counted as censored. We re-ran everything with 2- and 10-point thresholds, without Epoch's own benchmarks, and with ARC-AGI-3 counted as unsolved; the direction holds in all of them, the exact medians for 2024 and 2025–26 don't.
- Limits. Series for older benchmarks end where Papers with Code ends, so their best scores are floors. Points dated by model release can sit a few days off the date a score was first published. Lab tables report competitors' numbers as the lab measured them.
- Launch tables. Results tables from eight OpenAI launch pages (GPT-4 to GPT-6 Astra), read from Wayback captures, with variants merged into benchmark families and internal and safety evals left out.
- Context. arXiv counts come from the arXiv API (titles matching "benchmark", first-version submission dates, the three categories de-duplicated); the "introduces a benchmark" share is from 100 hand-coded papers. Anthropic counts are a text search of all 22 system-card PDFs listed on its site on 1 November 2026. METR, Epoch Capabilities Index and ARC Prize series are recomputed from each organisation's published data files.
The data pack, with every source, tier, the reconciliation log and a do-not-cite list, is in our repository at docs/research/2026-11-01-ai-benchmark-lifespan.md. The series behind every chart and the scripts that compute them are in docs/research/2026-11-01-ai-benchmark-lifespan-data/.
Open questions#
- What is in ARC Prize's provider adapter harness? It lifts GPT-6 Astra from 62.7% to 99.95% on ARC-AGI-3, and we found no public description of what it does.
- Are models answering GPQA's broken questions "correctly"? The best score (96.4%) is above Epoch's own 92% validity estimate. Contamination would explain it; so would a too-strict audit.
- Did anyone ever report MMLU at 95%? We found nobody after 2024. Labs moved to MMLU-Pro and multilingual variants before it got there.
- What replaces task-length measures once they top out? METR's suite can't reliably measure past 16 hours, and its page is no longer updated.
- How many of the 10 to 13 new benchmarks a day ever get used? We counted papers, not adoption. Most will probably never appear in a launch table.