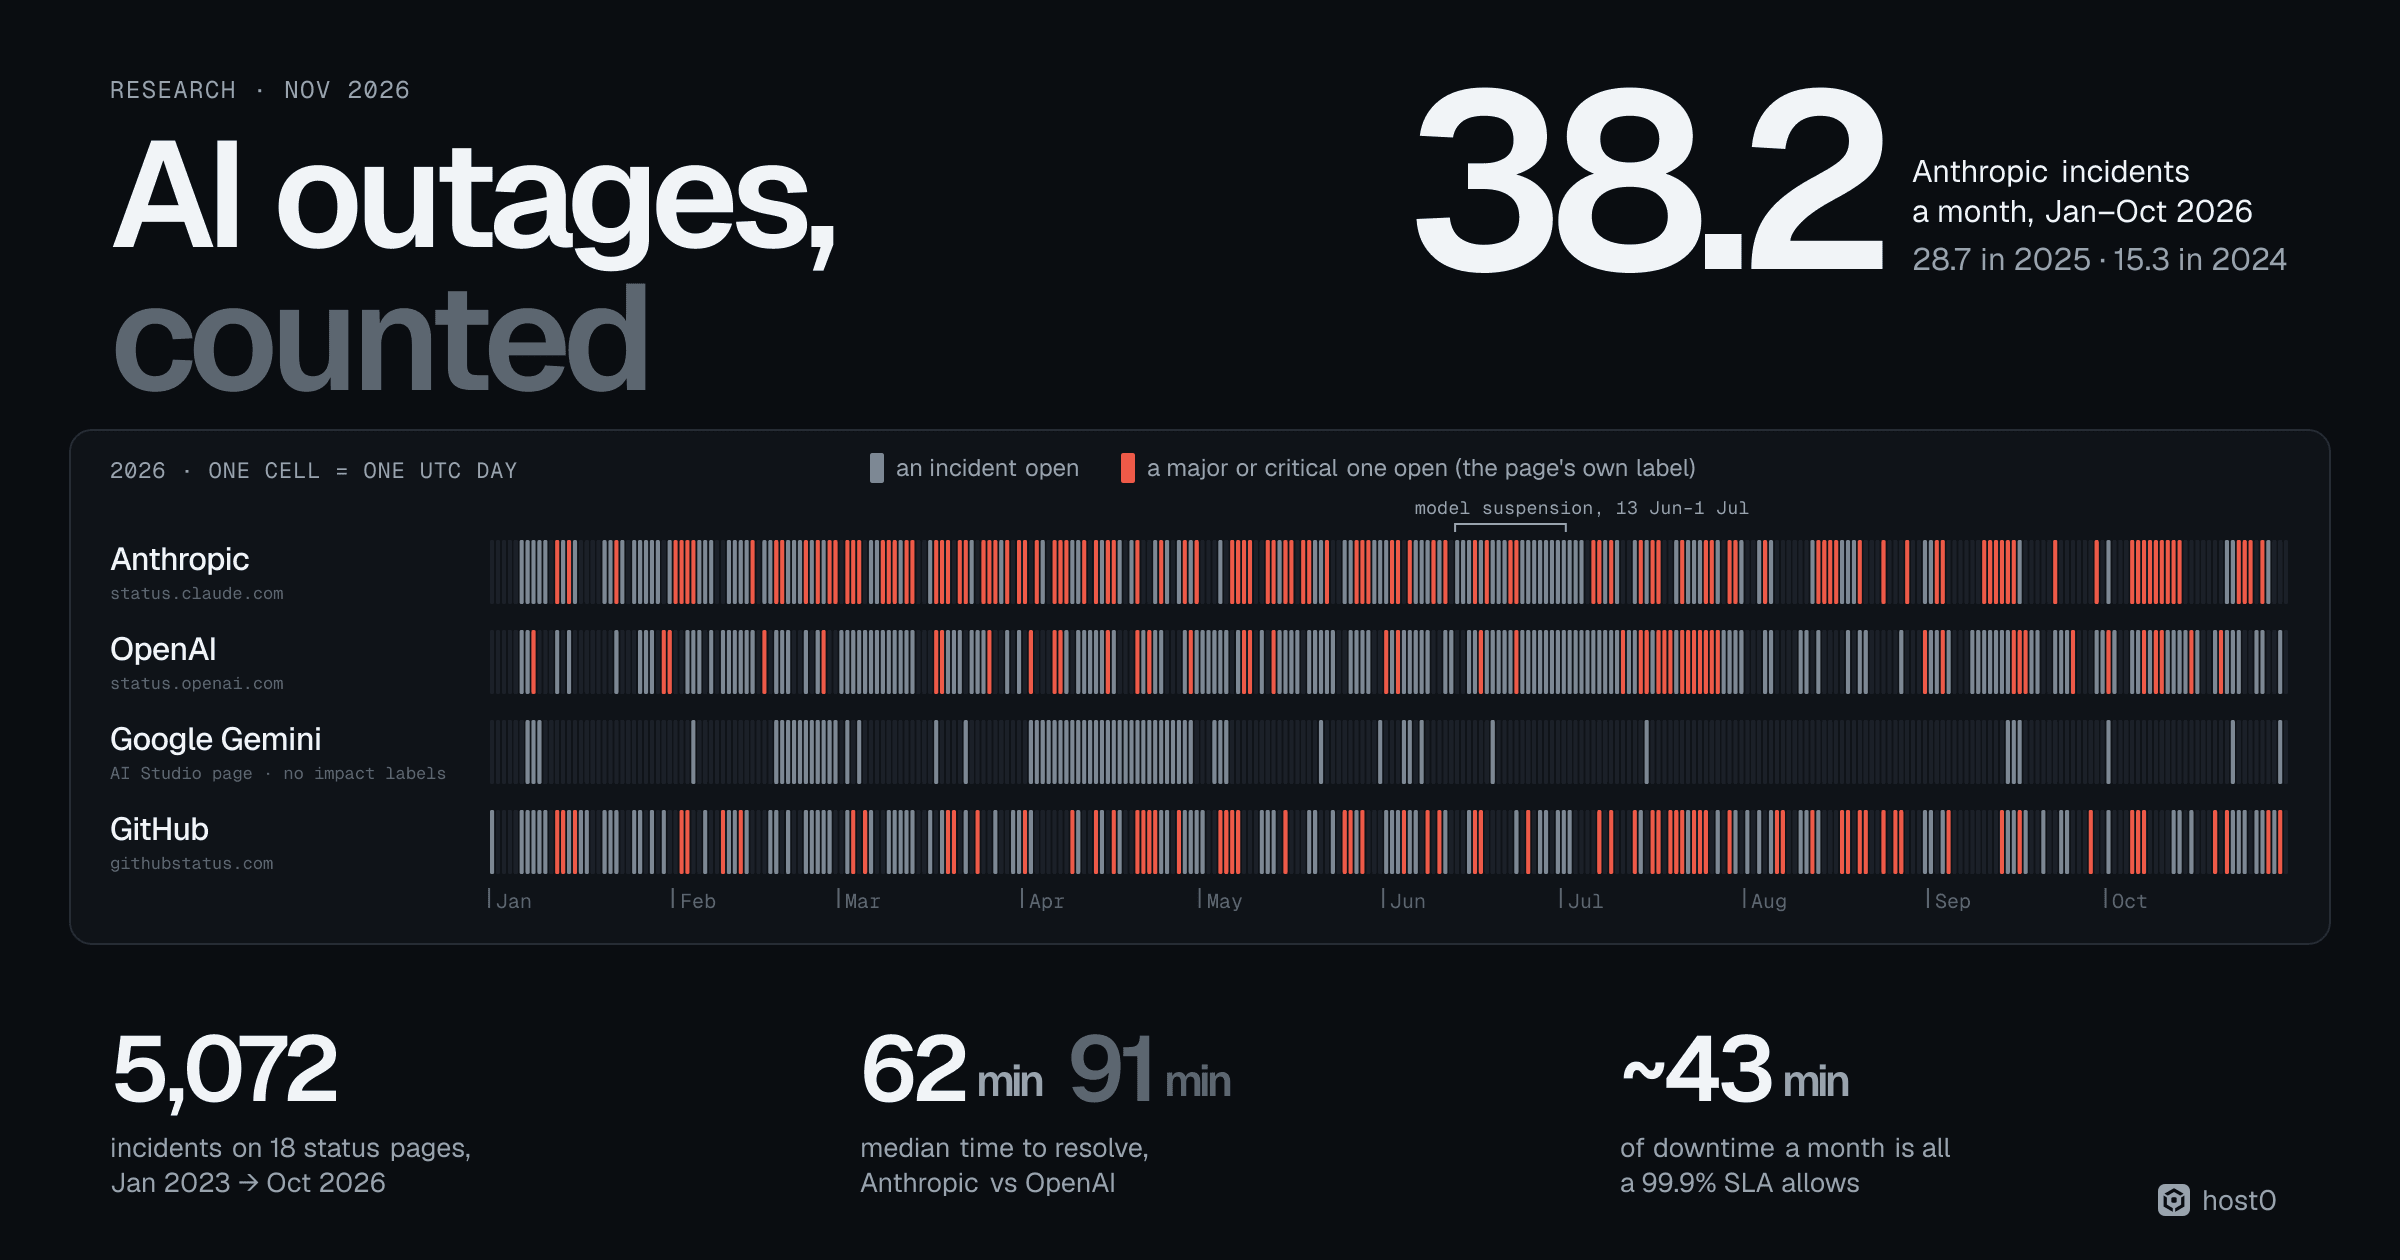
Every AI app has a dependency it can't see: a model provider that, a few times a month, starts answering with errors. When Claude or ChatGPT goes down, the story usually lasts an afternoon on social media and then disappears. Nobody keeps a running count, so it's hard to say whether things are getting better or worse, which provider fails more, or how long a typical outage lasts.
So we counted. We downloaded the full incident history of 18 public status pages, from Anthropic, OpenAI, Google, Groq, Cohere, Mistral, xAI and other model providers to the tools built on them (GitHub Copilot, Cursor, Vercel, Supabase, Lovable), and normalised every incident since January 2023 into one table. Then we read the postmortems of the biggest outages, the SLAs the providers sell, and the issue tracker where developers report errors. One warning up front: status pages are written by the companies themselves. Every count below measures what a company chose to publish, which is not the same as how often it failed. The methodology explains how we counted and where the counts fall short.
Key findings
- 1We counted 5,072 incidents on 18 status pages between 1 January 2023 and 31 October 2026, after removing duplicates. OpenAI (1,000) and Anthropic (934) posted the most, and they are the only two model providers whose own status pages have full, labelled history for the whole period.
- 2Anthropic posts more incidents every year. It posted 38.2 a month from January to October 2026, against 28.7 in the same months of 2025 and 15.3 in 2024. OpenAI posted 30.2 a month in 2026. More than half of Anthropic's 2026 incidents (217 of 382) name a single model, so part of the gap is how it posts.
- 3By its own labels, Anthropic also has more serious incidents. It labelled 12.8 incidents a month major or critical in 2026; OpenAI labelled 3.9. A major or critical Anthropic incident was open on 110 of the 304 days of 2026 (36%), not counting a deliberate 19-day suspension of two models that the page also labels critical.
- 4Anthropic resolves its incidents faster. The median Anthropic incident is closed in 62 minutes, OpenAI's in 91. Half of Anthropic's incidents (48.8%) close within an hour, about a third of OpenAI's (34.7%).
- 5Outages happen on workdays. Only 9.9% of model-provider incidents start on a Saturday or Sunday, against 28.6% if they were spread evenly, and 40% start between 14:00 and 19:59 UTC, the US morning and early afternoon.
- 6The biggest outages weren't model failures. None of the eight big outages whose postmortems we read was caused by a model: they were configuration pushes, a routine OS update, a telemetry rollout and a DNS race. On the worst days, a Cloudflare or Google Cloud failure put incidents on 11 or 12 of the 18 pages at once.
- 7An SLA covers less than you'd think. A 99.9% uptime SLA allows about 43 minutes of downtime a month. OpenAI's 9–10 June 2025 outage ran 924 minutes, 21 times that. The standard APIs of OpenAI and Anthropic come with no published uptime commitment at all.
- 8Developers see it as 529 errors. 257 issues in Claude Code's GitHub repository have "overloaded" or "529" in the title. They peaked at 52 in July 2025, and on 18 March 2026, a day when Anthropic's status page had four major incidents open, developers filed 18.
5,072
Incidents on 18 AI and developer-tool status pages, Jan 2023 to Oct 2026
Source: host0 count of status-page data
38.2
Anthropic incidents a month, Jan–Oct 2026; 28.7 in 2025 and 15.3 in 2024
Source: status.claude.com
62 min
Anthropic's median time to resolve an incident; OpenAI's is 91 min
Source: host0 count, 2023–2026
21×
OpenAI's 9–10 Jun 2025 outage (924 min) vs the ~43 min a month a 99.9% SLA allows
Source: OpenAI write-up
Who posts the most incidents#
Anthropic and OpenAI started 2024 at about the same rate, around 15 incidents a month each. Both roughly doubled in 2025. In 2026 Anthropic kept climbing while OpenAI levelled off.
Incidents posted per month, January to October
All incidents on each company's status page, per month, Jan–Oct of each year
| Label | Value |
|---|---|
| Anthropic, 2024 | 15.3 |
| Anthropic, 2025 | 28.7 |
| Anthropic, 2026 | 38.2 |
| OpenAI, 2024 | 16.5 |
| OpenAI, 2025 | 28.7 |
| OpenAI, 2026 | 30.2 |
Sources: host0 count; status.claude.com; status.openai.com
A count of posts is a count of a habit as much as of failures. Anthropic tends to post one incident per affected model ("Elevated errors on Claude Opus 4.6"): 217 of its 382 incidents in 2026 name a model. OpenAI more often groups several problems under one incident. The quarterly view shows how fast the habit can change: Anthropic posted around 45 incidents per 30 days in the first half of 2026, then 30 in the third quarter and 16.5 in October, while the number it labelled major or critical fell much less, from about 14 to about 10 per 30 days.
Incidents per 30 days, by quarter
All incidents on each status page, per 30 days, quarter starting at the date shown, 2023 to Oct 2026
| Series | x | y |
|---|---|---|
| Anthropic | Apr 2023 | 3.6 |
| Anthropic | Jul 2023 | 3.3 |
| Anthropic | Oct 2023 | 2.3 |
| Anthropic | Jan 2024 | 10.5 |
| Anthropic | Apr 2024 | 14.5 |
| Anthropic | Jul 2024 | 17.6 |
| Anthropic | Oct 2024 | 18.9 |
| Anthropic | Jan 2025 | 18.7 |
| Anthropic | Apr 2025 | 29 |
| Anthropic | Jul 2025 | 40.4 |
| Anthropic | Oct 2025 | 21.5 |
| Anthropic | Jan 2026 | 45 |
| Anthropic | Apr 2026 | 45.5 |
| Anthropic | Jul 2026 | 30 |
| Anthropic | Oct 2026 | 16.5 |
| OpenAI | Jan 2023 | 18 |
| OpenAI | Apr 2023 | 11.9 |
| OpenAI | Jul 2023 | 16.3 |
| OpenAI | Oct 2023 | 10.4 |
| OpenAI | Jan 2024 | 19.5 |
| OpenAI | Apr 2024 | 18.1 |
| OpenAI | Jul 2024 | 13 |
| OpenAI | Oct 2024 | 10.8 |
| OpenAI | Jan 2025 | 24 |
| OpenAI | Apr 2025 | 29 |
| OpenAI | Jul 2025 | 32.3 |
| OpenAI | Oct 2025 | 26.1 |
| OpenAI | Jan 2026 | 25 |
| OpenAI | Apr 2026 | 29.7 |
| OpenAI | Jul 2026 | 31 |
| OpenAI | Oct 2026 | 40.6 |
Source: host0 count of status-page data
For anyone building on the API, one more difference matters. 69% of Anthropic's incidents touch its API, against 36% of OpenAI's, and 28% in 2026: most OpenAI incidents are about ChatGPT, Sora or Codex, not the API apps call. In 2026, 267 of Anthropic's 382 incidents listed the API, against 85 of OpenAI's 302.
What the pages call major#
Each page also labels its incidents: minor, major or critical. The label is the provider's own call (on incident.io pages it follows the worst component colour), so it isn't comparable across companies to the decimal. It is the best filter there is, though, because it is much less sensitive to how many small notices a company posts.
Incidents labelled major or critical, per month, 2026
Incidents the status page itself labels major or critical, per month, Jan–Oct 2026
| Label | Value |
|---|---|
| Anthropic | 12.8 (2025: 10.6) |
| GitHub | 7.8 (2025: 2.8) |
| Lovable | 5 |
| OpenAI | 3.9 (2025: 6.7) |
| Supabase | 3.6 (2025: 2.0) |
| Vercel | 2.7 (2025: 2.4) |
| v0 | 1.3 (2025: 0.2) |
| Perplexity | 0.9 (2025: 0.8) |
| Cohere | 0.4 (2025: 0.2) |
| Groq | 0.1 (2025: 2.5) |
Source: host0 count of status-page data
Anthropic's serious incidents went up while OpenAI's went down, and GitHub's nearly tripled. Counted in days, Anthropic had a major or critical incident open on 110 of the 304 days of 2026 so far. Its page actually shows 125, but 15 of those days come from one long incident titled "We've suspended access to Claude Mythos 5 and Claude Fable 5", open from 13 June to 1 July and labelled critical. That was a deliberate suspension of two models, not an outage, so we show both numbers.
Days with a major or critical incident open, 2026
Share of the 304 UTC days from 1 Jan to 31 Oct 2026 touched by an open major or critical incident
| Label | Value |
|---|---|
| Anthropic, as posted | 41.1% (125 days) |
| Anthropic, without the suspension | 36.2% (110 days) |
| GitHub | 22.4% (68 days) |
| Lovable | 16.8% (51 days) |
| OpenAI | 15.5% (47 days) |
| Supabase | 12.5% (38 days) |
| Vercel | 8.9% (27 days) |
| GitHub Copilot | 6.9% (21 days) |
| v0 | 4.9% (15 days) |
| Perplexity | 3.3% (10 days) |
Source: host0 count of status-page data
GitHub's labels changed the most. It marked 36 incidents critical in the first ten months of 2026, after one in all of 2023, 2024 and 2025 together. GitHub Copilot alone had 67 incidents in that time, against 34 in all of 2025. We can't tell from the pages whether that's more failures or a new way of labelling them.
GitHub incidents labelled critical
Incidents on githubstatus.com with the critical label, per year, 2023 to 31 Oct 2026
| Label | Value |
|---|---|
| 2023 | 1 |
| 2024 | 0 |
| 2025 | 0 |
| 2026 | 36 (to Oct) |
Sources: host0 count; githubstatus.com
How fast they fix it#
Here the picture flips. Anthropic posts more incidents than OpenAI and labels more of them serious, but it closes them faster: a median of 62 minutes from the start of an incident to the "resolved" post, against 91 for OpenAI. The slow tail is where the difference is largest. One in ten Anthropic incidents stays open longer than 4.9 hours; for OpenAI that's 11.7 hours.
Median time to resolve an incident
Minutes from the start of an incident to its resolved post, all incidents, 2023 to Oct 2026
| Label | Value |
|---|---|
| Supabase | 176 min (mitigated: 64) |
| OpenAI | 91 min (mitigated: 49) |
| Groq | 86 min (mitigated: 60) |
| Cohere | 81 min (mitigated: 40) |
| Vercel | 75 min (mitigated: 44) |
| GitHub | 65 min (mitigated: 59) |
| Anthropic | 62 min (mitigated: 38) |
| Lovable | 50 min (mitigated: 36) |
Source: host0 count of status-page data
Durations on a status page are posting windows: from the first post, or the start time the provider gives, to the resolved post. They include the monitoring tail and can run longer than the outage. OpenAI's 11 December 2024 incident is open for 426 minutes on its page; the impact window in its postmortem is 262. Still, the shape is consistent with an outside study. Researchers at VU Amsterdam found that, in public data through August 2024, the median time to recover was 0.77 hours for the Anthropic API and 1.23 hours for the OpenAI API, and that ChatGPT's failures "take longer to resolve but occur less frequently" than Claude's.
Incidents closed within an hour
Share of each page's incidents resolved in under 60 minutes, 2023 to Oct 2026
| Label | Value |
|---|---|
| Lovable | 56.5% (n=269) |
| Anthropic | 48.8% (n=934) |
| GitHub | 47.4% (n=744) |
| Cohere | 43.9% (n=66) |
| Vercel | 41.8% (n=459) |
| Groq | 37% (n=119) |
| OpenAI | 34.7% (n=1,000) |
| Supabase | 16.3% (n=423) |
Source: host0 count of status-page data
So more posts isn't automatically worse. A company that posts every blip, and closes most of them within an hour, can look worse in a count than one that posts less and takes longer. The two measures that matter most for an app, how often the API itself is affected and how long it takes to recover, point in different directions for the two biggest providers.
When it breaks#
Incidents follow the working week. On the seven model-provider pages that give exact times, only 9.9% of incidents started on a Saturday or Sunday. Tuesday and Wednesday are the worst days.
Incidents by day of the week
Incidents by UTC start day, 7 model-provider pages, 2023 to Oct 2026
| Label | Value |
|---|---|
| Mon | 396 |
| Tue | 495 |
| Wed | 503 |
| Thu | 441 |
| Fri | 390 |
| Sat | 149 |
| Sun | 95 |
Source: host0 count of status-page data
The hour of day tells the same story. 40% of incidents start between 14:00 and 19:59 UTC, which is 7 am to 1 pm on the US West Coast in summer, and the single worst hour is 18:00 UTC. That fits what the postmortems below describe: most big outages start with a change someone made, and changes are made during working hours.
Incidents by hour of day
Incidents by UTC start hour, 7 model-provider pages, 2023 to Oct 2026
| x | y |
|---|---|
| 0 | 105 |
| 1 | 91 |
| 2 | 69 |
| 3 | 65 |
| 4 | 36 |
| 5 | 43 |
| 6 | 61 |
| 7 | 89 |
| 8 | 87 |
| 9 | 77 |
| 10 | 49 |
| 11 | 51 |
| 12 | 62 |
| 13 | 123 |
| 14 | 157 |
| 15 | 152 |
| 16 | 146 |
| 17 | 164 |
| 18 | 198 |
| 19 | 172 |
| 20 | 123 |
| 21 | 121 |
| 22 | 121 |
| 23 | 107 |
Source: host0 count of status-page data
The biggest outages weren't the models#
We read the postmortems of eight big outages behind AI services since late 2024. None of them was a model failing. Every one began with a change to configuration or infrastructure: a feature file that doubled in size, a quota policy with blank fields, an operating-system update, a DNS automation race.
Big outages and what caused them
11 Dec 2024
11 Dec 2024
OpenAI: API, ChatGPT and Sora down for 4 h 22 min
A new telemetry service overloaded the Kubernetes control planes, and DNS then failed.10 Jun 2025
10 Jun 2025
A daily OS update restarted systemd-networkd and removed the network routes on GPU nodes. Errors peaked at about 35% in ChatGPT and 25% on the API.12 Jun 2025
12 Jun 2025
Google Cloud, including the Vertex Gemini API
A quota policy with blank fields crashed Service Control worldwide. The code had no error handling and no feature flag.17 Sep 2025
17 Sep 2025
Anthropic explains a month of worse answers
Three overlapping infrastructure bugs from 5 August; at the worst hour 16% of Sonnet 4 requests were affected.20 Oct 2025
20 Oct 2025
A latent race condition in DynamoDB's DNS automation left the endpoint with no addresses. Perplexity, Vercel and Supabase all posted critical incidents that day.29 Oct 2025
29 Oct 2025
Azure Front Door for 8 h 24 min
Valid customer configuration produced metadata that exposed a latent bug at the edge.18 Nov 2025
18 Nov 2025
A database permissions change doubled the size of a feature file past its 200-feature limit, and the proxy crashed.5 Dec 2025
5 Dec 2025
A firewall configuration change hit a bug that had gone undetected for years.29 Sep 2026
29 Sep 2026
Azure OpenAI in Sweden Central for 5 h 55 min
A deployment cleared an internal service's caches at peak hours and exhausted its backend connections.
Source: Each provider's postmortem; durations are first impact to full recovery
Anthropic's quality drop in August and September 2025 is on the list although nothing went down, because its cause was the same kind. Its postmortem traced the problems users reported to "infrastructure bugs alone": a routing bug, an output corruption and a compiler error on TPUs. About 30% of Claude Code users who made requests in that period had at least one message routed to the wrong server type.
Several postmortems name the same missing guards. Google's change "did not have appropriate error handling nor was it feature flag protected", and its recovery was slowed because Service Control lacked "randomized exponential backoff". OpenAI's June recovery was slowed by "the absence of break-glass tooling". Cloudflare called 18 November "Cloudflare's worst outage since 2019" and said it was not an attack.
The cloud outages are also the days when AI fails all at once. On an ordinary day between June and December 2025, three of our 18 pages had a new incident. On the day of the Cloudflare outage, twelve did.
Status pages with a new incident on the day of a big outage
Of our 18 status pages, how many had an incident start on that UTC day, 2025
| Label | Value |
|---|---|
| Cloudflare, 18 Nov 2025 | 12 (8 major) |
| Google Cloud, 12 Jun 2025 | 11 (6 major) |
| AWS us-east-1, 20 Oct 2025 | 10 (8 major) |
| Cloudflare, 5 Dec 2025 | 7 (4 major) |
| Azure Front Door, 29 Oct 2025 | 6 (1 major) |
| A typical day, Jun–Dec 2025 | 3 (median) |
Source: host0 count of status-page data
On 12 June 2025, Anthropic, OpenAI, the Gemini API, Groq, Cohere and Vertex AI all had an incident open, along with Cursor, GitHub Copilot and Lovable. A second model provider is a good fallback, but on days like these it may be on the same cloud.
What an SLA covers#
The usual answer to outages is an SLA, a contract that promises uptime. The arithmetic is unforgiving. A 99.9% monthly SLA allows 43 minutes of downtime in a 30-day month, and a 99.5% one allows 3.6 hours. Most of the outages above were longer than a whole month's 99.9% allowance on their own.
Big outages against a 99.9% monthly allowance
Minutes from first impact to full recovery, per the provider's postmortem, vs 43 min allowed per 30 days
| Label | Value |
|---|---|
| OpenAI, 9–10 Jun 2025 | 924 min (21×) |
| AWS us-east-1, 19–20 Oct 2025 | 872 min (20×) |
| Azure Front Door, 29–30 Oct 2025 | 504 min (12×) |
| Google Cloud, 12 Jun 2025 | 447 min (10×) |
| Azure OpenAI, 29 Sep 2026 | 355 min (8×) |
| Cloudflare, 18 Nov 2025 | 346 min (8×) |
| OpenAI, 11 Dec 2024 | 262 min (6×) |
| Cloudflare, 5 Dec 2025 | 25 min (0.6×) |
| 99.9% SLA, one month | 43 min |
Sources: Provider postmortems; host0 arithmetic
And most AI APIs don't come with one. Anthropic's documentation says standard API requests run with "best-effort availability". Its Priority Tier "targets 99.5 percent uptime", but the same page now calls service tiers legacy and says Priority Tier commitments are no longer sold. OpenAI's 99.9% SLA comes with Scale Tier and Fast mode, and only for Enterprise customers. The Scale Tier page says it's available on models released before GPT-5.6, with newer models on a separate Reserved Tier.
What the AI APIs promise
Published uptime commitments, as of October 2026
- Claude API, standard: no uptime number; "best-effort availability". Priority Tier targets 99.5% for existing commitments only.
- OpenAI API, standard: none published. Scale Tier (models before GPT-5.6) and Fast mode: 99.9% uptime plus a latency SLA, for Enterprise customers only.
- Amazon Bedrock (Claude and others): 99.9% a month per region, measured in 5-minute intervals; credits of 10%, 25% or 100%.
- Azure OpenAI: 99.9%.
- Vertex AI, Gemini: 99.5%, and downtime counts only above a 5% error rate.
Sources: Anthropic; OpenAI Scale Tier (Wayback, 15 Oct 2026); OpenAI Fast mode (Wayback, 17 Aug 2026); AWS; Google Cloud; Microsoft
The pattern is that the SLAs live with the clouds. If an uptime promise matters to you, you buy the same model through Bedrock, Vertex or Azure, and even then the credit is a share of your bill. For scale, the AWS outage alone cost US companies an estimated $500 million to $650 million, according to the insurer Parametrix, across everything that runs on AWS, not only AI.
What developers see: 529s#
When Anthropic's API is overloaded it returns a 529, which its documentation describes as an error that "can occur when the API experiences high traffic across all users". It's separate from the 429 a single account gets for going over its rate limit. For people using Claude Code, a 529 is what an outage looks like, so we counted the GitHub issues in anthropics/claude-code with "overloaded" or "529" in the title.
Claude Code issues titled "overloaded" or "529"
Issues opened per month in anthropics/claude-code with either word in the title, Feb 2025 to Oct 2026
| x | y |
|---|---|
| Feb 2025 | 0 |
| Mar 2025 | 6 |
| Apr 2025 | 0 |
| May 2025 | 1 |
| Jun 2025 | 10 |
| Jul 2025 | 52 (52 · Jul 2025) |
| Aug 2025 | 7 |
| Sep 2025 | 13 |
| Oct 2025 | 0 |
| Nov 2025 | 4 |
| Dec 2025 | 1 |
| Jan 2026 | 5 |
| Feb 2026 | 4 |
| Mar 2026 | 47 (47 · Mar 2026) |
| Apr 2026 | 18 |
| May 2026 | 15 |
| Jun 2026 | 20 |
| Jul 2026 | 28 |
| Aug 2026 | 16 |
| Sep 2026 | 5 |
| Oct 2026 | 5 |
Source: host0 count of GitHub issues
The July 2025 peak came just before Anthropic announced weekly usage limits for Claude Code. "Claude Code has experienced unprecedented demand since launch," an Anthropic spokesperson told TechCrunch at the time. The March 2026 spike followed a 2 March outage in which claude.ai and Claude Code sign-ins failed while the API kept working; Bloomberg's headline said Claude went down amid "unprecedented demand".
Developers and the status page mostly agree. On all nine days with the most such issues, Anthropic's status page had an incident open, and on six of them a major or critical one. On 18 March 2026, the busiest day with 18 issues, the page had four incidents open, all major, three of them about Opus 4.6. The issue titles say what an outage costs in an agent workflow: one, #89267, reads "Subagent killed by 529 Overloaded loses all work — no partial result, full relaunch required".
Routing around it#
The common fix is a second route to the same model. OpenRouter, which sends requests to many hosts of the same models, publishes a one-day success rate for every host it routes to. We took one snapshot, for the 24 hours to 19:00 UTC on 31 October 2026, across 1,335 endpoints. It's one day, every endpoint counts once whatever its traffic, and 429 rate-limit errors don't count as failures, so it's not a ranking. It does show what redundancy buys.
What a second host buys, one day on OpenRouter
Share of endpoints or models, 24 h to 19:00 UTC on 31 Oct 2026
| Label | Value |
|---|---|
| Endpoints below 99% success | 17.7% (of 1,335) |
| Models with 2+ hosts: one below 99% | 50% (of 182) |
| Models with 2+ hosts: best host at 99.9%+ | 90.7% (of 182) |
On that day every Claude endpoint served directly by Anthropic, by Claude Platform on AWS and by Bedrock answered 100% of requests; on another day the numbers will be different. The lesson isn't which host is best. It's that any one of them has bad days, and the chance that all of them do at once is much smaller.
What this means if you build with AI#
- Retry, with backoff and jitter. Treat 529, 503 and other 5xx errors as temporary: retry a few times with exponential backoff, add random jitter, and honour the
retry-afterheader. Anthropic's SDK already retries twice by default. The jitter matters: Google's own recovery on 12 June 2025 was slowed by retries without it. Don't retry a 400, and cap the total time. - Have a second provider for the same model. Claude is sold by Anthropic, Bedrock and Vertex; GPT models by OpenAI and Azure. That's also where the SLAs are. Keep the keys set up and the code path tested, because a fallback you've never run doesn't work on the day you need it.
- Have a fallback model for when a whole provider is down. Big outages last hours: a quarter of OpenAI's incidents stayed open four hours or more. Pick a model from another company, test your prompts on it, and keep the conversation history on your side so you can hand it over.
- Watch the status pages, and don't wait for them. Most of the pages we read publish an RSS or Atom feed or a JSON list of incidents, so you can pipe them into Slack. Subscribe to the clouds too: a Cloudflare or Google Cloud incident reaches every AI provider at once. But alert on your own error rate as well, because many incidents are posted after they started.
- Design the degraded state. Decide what your app does when the model is unavailable: queue the request, show a cached answer, or say plainly that the AI part is down and the rest still works. It's much easier to build that before the first outage than during it.
- Don't let your coding agent be your deploy path. If shipping a fix needs Claude Code or Cursor to be up, an outage on their side stops your release. Keep deploys in a script or a CI step you can run by hand, and have long agent runs save their work as they go: a subagent killed by a 529 can lose everything.
- Expect trouble on weekday afternoons, UTC. Most incidents start between 14:00 and 20:00 UTC on a weekday. If your traffic peaks then too, that's when to have someone watching.
We build host0 for the step after the build: an app your agent made goes live at a link you can share. Publishing is a plain script and a REST call, so it doesn't need the agent that wrote the app to be up.
Methodology#
We used public data only, collected on 31 October 2026.
- Status pages. The full incident history of 13 status pages: Anthropic, GitHub and Vercel through each Atlassian Statuspage's history and per-incident JSON; OpenAI, Groq, Fireworks, Cohere, Perplexity, Supabase, Lovable and v0 through each incident.io page's own JSON, one month at a time; Google Cloud (for Vertex AI incidents) by combining 49 monthly Wayback captures of its rolling 365-day incident file with the live one. The Gemini API's AI Studio page was read once in a browser. Five more pages are partial: xAI, Cursor and DeepSeek rebuilt from Wayback captures of their feeds, Mistral and Replit from their last 50 incidents only. Together AI and OpenRouter publish no incident history we could reach.
- Normalisation. One row per incident, 1 January 2023 to 31 October 2026, all times in UTC. Scheduled maintenance is dropped. The start is the earliest time the page gives, including backdated starts; resolved is the first "resolved" post after the last unresolved one, so later postmortem posts don't stretch durations. Impact is the page's own label; on incident.io pages it's the worst component status, the same mapping their own feeds use. We removed 63 duplicates (same title within 5 minutes), 60 of them on xAI's feed.
- Checks. We re-read 20 random incidents on their own pages (titles 20 of 20, Atlassian labels and times 11 of 11, incident.io start times 9 of 9), compared 200 incident.io incidents with each page's own feed (impact agreed on 199), and checked that each Atlassian page's latest 50 incidents were all in our set.
- Limits. Status pages are self-reported: counts measure what a company publishes, and companies post at different granularity. Labels are each company's call. Durations are posting windows and include monitoring tails. 2026 runs to October, so we compare monthly rates, never totals. Pages without labels (Gemini API, xAI, DeepSeek), with partial history, or with automated per-model incidents (Fireworks) are left out of comparisons.
- Postmortems and SLAs. The postmortems, SLA pages and API docs we cite were read on 31 October 2026; Anthropic's service tiers page had changed since our first read, and OpenAI's Scale Tier and Fast mode pages block scripts, so they were read through Wayback copies from 15 October and 17 August.
- Claude Code issues. GitHub's issue search for
anthropics/claude-code, issues with "overloaded" or "529" in the title (257), by month opened. 28 of 30 random matches were about overload errors. Many reports have other titles, so it's a floor. - OpenRouter. One pull of every model's endpoints from the public API at 19:00 UTC on 31 October 2026, using each endpoint's
uptime_last_1d(successful requests over all requests, not counting user errors or 429s). 145 endpoints without enough traffic were left out.
The data pack, with every source, tier, the spot-check log and a do-not-cite list, is in our repository at docs/research/2026-10-31-ai-outages.md. The full incident table (incidents.csv), the series behind every chart and the scripts that compute them are in docs/research/2026-10-31-ai-outages-data/.
Open questions#
- Why did Anthropic's count halve after July 2026? Its major and critical incidents didn't fall with it. A change in how it posts is the likeliest reading, but the page doesn't say.
- Is GitHub failing more, or labelling differently? 36 critical incidents in ten months, after one in three years, looks like a policy change as much as a reliability one.
- How much downtime do status pages miss? Every number here is what a company chose to post. An independent monitor of real API calls, over months and weighted by traffic, would answer it; we didn't find a public one.
- What does a coding-agent outage cost? Nobody has measured the developer hours lost when Claude Code, Codex or Cursor stall. We found no credible estimate.