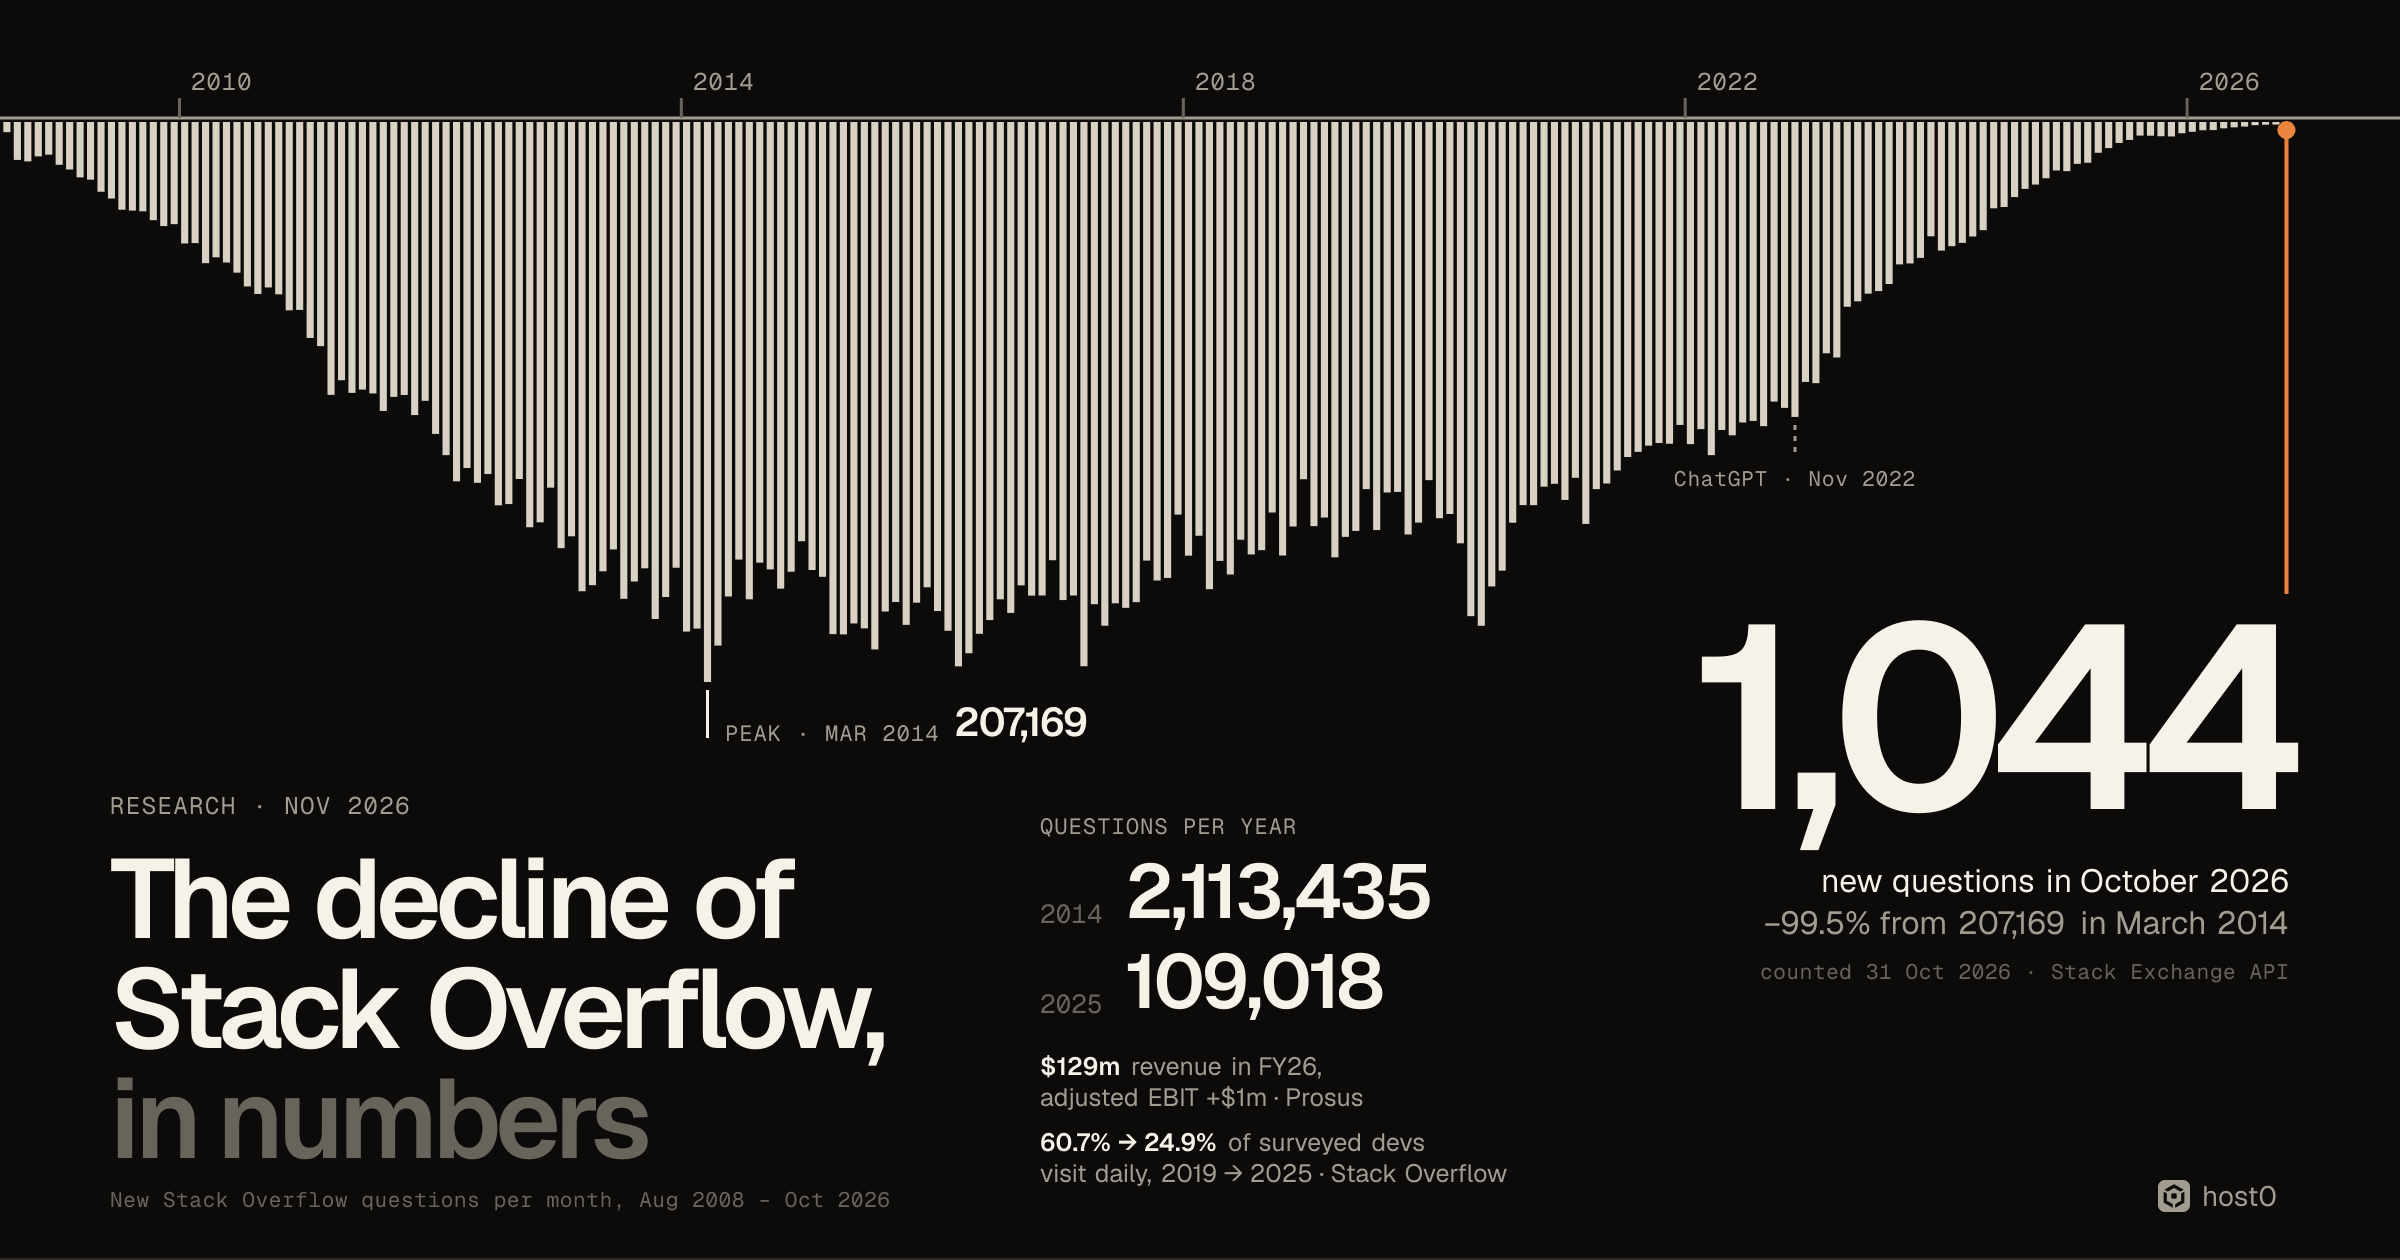
For fifteen years, Stack Overflow was where programming questions went to get answered in public. Somebody hit an error, asked, and a stranger replied; the next person with the same error found the thread through a search engine. That archive of questions and answers became one of the most-read corners of the web, and later one of the datasets language models learned to code from.
People still say Stack Overflow is dying, mostly on the strength of one chart. We wanted the numbers behind it. On 31 October 2026 we counted every month of new questions since 2008 through the public Stack Exchange API, then checked the count against deletions using post ids and 68 archived copies of the site's own question counter. We set that next to the company's results as reported by its owner, Prosus, the Stack Overflow Developer Survey, the research on ChatGPT's effect, and a count of GitHub Discussions, the most obvious place for the questions to go. The methodology explains how, and where each number falls short.
Key findings
- 1New questions are down 99.5% from the peak. Stack Overflow got 1,044 new questions in October 2026, by our count on 31 October, against 207,169 in March 2014. It's been about 1,000 a month since July. All 19,855 questions of January to October 2026 add up to about three days of March 2014.
- 2The fall began before ChatGPT and sped up after it. Questions fell 27% between 2017 and 2021. Then they fell 41% in 2023, 49% in 2024, 73% in 2025 and 80% in the first ten months of 2026, each against the year before. There were 109,018 questions in 2025, against 2,113,435 in 2014.
- 3It isn't an artefact of deletions. Post ids, which deleted posts keep, fell 92% between 2014 and 2025. The site's own question counter has been shrinking since April 2025: more old questions are being deleted than new ones are asked.
- 4Answering is holding up a little better, but less of it reaches new questions. Answers fell 94.1% from 2014 to 2025, about as fast as questions. About a third of October 2025's questions still have no answer, against 10.9% of October 2014's, a share that understates how many old questions went unanswered.
- 5AI questions never took off on the site. Questions tagged openai-api, langchain, large-language-model or huggingface-transformers peaked at 3,797 in 2023 and were down to 723 in 2025. Even at their highest share, in 2024, they made up under 0.7% of all questions.
- 6The company is now profitable. Stack Overflow's revenue rose from $94m to $129m between Prosus's fiscal 2023 and 2026, and its adjusted EBIT went from a loss of $84m to a profit of $1m. Prosus says its data-licensing API was "primarily responsible" for the growth in fiscal 2025.
- 7Developers come back less often. In Stack Overflow's own survey, 60.7% of respondents visited daily or more in 2019 and 24.9% in 2025. In 2026, 64.1% of those who answered the question said AI made them visit less for simple questions.
- 8GitHub didn't absorb the questions. GitHub Discussions marked as answered fell 47% between the first halves of 2023 and 2026, while discussions created rose 24%.
1,044
New Stack Overflow questions in October 2026 (counted 31 Oct 2026), −99.5% vs 207,169 in March 2014
Source: host0 count, Stack Exchange API
109,018
Questions asked in all of 2025, against 2,113,435 in 2014; 19,855 in January to October 2026
Source: host0 count, Stack Exchange API
$129m
Stack Overflow revenue in fiscal 2026, with adjusted EBIT of +$1m (fiscal 2023: $94m and −$84m)
Source: Prosus FY26 results
24.9%
Developer Survey respondents who visit Stack Overflow daily or more, 2025 (60.7% in 2019)
Source: Stack Overflow Developer Survey
A 99.5% fall in new questions#
The Stack Exchange API returns an exact count of questions created between any two dates. We asked it for every month from the site's beta in July 2008 to October 2026, 219 requests in all. The counts include open and closed questions of any score, but not deleted ones; the next section deals with that.
New Stack Overflow questions in one month
Questions created in the month and still on the site, counted 31 Oct 2026
| Label | Value |
|---|---|
| Mar 2014 | 207,169 (the peak) |
| Nov 2022 | 109,120 (ChatGPT launches) |
| Oct 2024 | 23,161 |
| Oct 2025 | 5,263 |
| Oct 2026 | 1,044 (−99.5% vs peak) |
Source: host0 count, Stack Exchange API
Stack Overflow grew for six years and then sat on a plateau. Every year from 2013 to 2017 brought at least 2 million questions, with 2016 the busiest (2,182,773). The single busiest month was March 2014, with March 2016 and March 2017 just behind at about 201,000 each.
Stack Overflow questions per year
Questions created each calendar year and still on the site, counted 31 Oct 2026
| Label | Value |
|---|---|
| 2008 | 57.1K (from Jul) |
| 2009 | 340.2K |
| 2010 | 688.4K |
| 2011 | 1.2M |
| 2012 | 1.6M |
| 2013 | 2M |
| 2014 | 2.1M |
| 2015 | 2.2M |
| 2016 | 2.2M |
| 2017 | 2.1M |
| 2018 | 1.9M |
| 2019 | 1.8M |
| 2020 | 1.9M |
| 2021 | 1.5M |
| 2022 | 1.3M |
| 2023 | 787.6K |
| 2024 | 398.3K |
| 2025 | 109K |
| 2026 | 19.9K (Jan–Oct) |
Source: host0 count, Stack Exchange API
The decline started well before AI. Questions fell 27% between 2017 and 2021, and another 13% in 2022. The only bump was the pandemic: April and May 2020, at 182,820 and 186,376, were the busiest months since 2017. Every month from July 2011 to November 2022 had at least 100,000 questions. December 2022, ChatGPT's first full month, was the first to fall short.
After that the fall sped up every year. 2023 was 41% below 2022, 2024 was 49% below 2023, and 2025 was 73% below 2024. January to October 2026 is 80% below the same months of 2025.
How fast questions fell each year
Change in questions against the previous year, 2021 to Jan–Oct 2026
| Label | Value |
|---|---|
| 2021 | −17.3% |
| 2022 | −13.0% |
| 2023 | −41.0% |
| 2024 | −49.4% |
| 2025 | −72.6% |
| 2026 | −80.0% (Jan–Oct) |
Source: host0 count, Stack Exchange API
On a linear scale the last two years look like zero, so the monthly series below uses a log scale, where a constant rate of decline is a straight line. The line bends down: the rate of decline grew. Since July 2026 it has flattened at about 1,000 questions a month.
New questions per month, since 2022
Questions created each month and still on the site, log scale, Jan 2022 to Oct 2026 (counted 31 Oct 2026)
| x | y |
|---|---|
| Jan 2022 | 119,166 |
| Feb 2022 | 113,638 |
| Mar 2022 | 123,261 |
| Apr 2022 | 113,932 |
| May 2022 | 115,910 |
| Jun 2022 | 111,157 |
| Jul 2022 | 110,578 |
| Aug 2022 | 112,525 |
| Sep 2022 | 103,417 |
| Oct 2022 | 105,743 |
| Nov 2022 | 109,120 (ChatGPT) |
| Dec 2022 | 96,161 |
| Jan 2023 | 96,622 |
| Feb 2023 | 85,569 |
| Mar 2023 | 87,123 |
| Apr 2023 | 68,351 |
| May 2023 | 66,341 |
| Jun 2023 | 63,491 |
| Jul 2023 | 62,557 |
| Aug 2023 | 59,938 |
| Sep 2023 | 52,684 |
| Oct 2023 | 52,334 |
| Nov 2023 | 50,273 |
| Dec 2023 | 42,283 |
| Jan 2024 | 47,570 |
| Feb 2024 | 45,922 |
| Mar 2024 | 44,707 |
| Apr 2024 | 42,361 |
| May 2024 | 40,021 |
| Jun 2024 | 31,930 |
| Jul 2024 | 31,435 |
| Aug 2024 | 27,779 |
| Sep 2024 | 24,730 |
| Oct 2024 | 23,161 |
| Nov 2024 | 20,806 |
| Dec 2024 | 17,913 |
| Jan 2025 | 18,182 |
| Feb 2025 | 15,498 |
| Mar 2025 | 15,075 |
| Apr 2025 | 11,385 |
| May 2025 | 9,645 |
| Jun 2025 | 7,748 |
| Jul 2025 | 6,621 |
| Aug 2025 | 5,020 |
| Sep 2025 | 5,072 |
| Oct 2025 | 5,263 |
| Nov 2025 | 5,347 |
| Dec 2025 | 4,162 |
| Jan 2026 | 3,614 |
| Feb 2026 | 3,042 |
| Mar 2026 | 2,987 |
| Apr 2026 | 2,322 |
| May 2026 | 1,986 |
| Jun 2026 | 1,700 |
| Jul 2026 | 1,175 |
| Aug 2026 | 1,019 |
| Sep 2026 | 966 |
| Oct 2026 | 1,044 |
Source: host0 count, Stack Exchange API
The fall is real, not a deletion effect#
There is a fair objection to any chart like this. The API only sees questions that still exist. Stack Overflow deletes closed, unanswered and low-scoring questions, and an old month has had a decade to lose its weak questions while last month hasn't been cleaned up yet. That bias would make the old peak look smaller, so if anything it understates the fall. But we checked the size of it three ways.
First, the site's own counter. The questions page shows how many questions exist at that moment, and the Wayback Machine has archived it about once a quarter since 2009. The sum of our 219 monthly counts is 24,134,444; the counter read 24,135,704 on 1 October 2026, within 0.005%. The counter peaked at 24,249,972 on 1 April 2025 and has fallen every quarter since.
Questions on Stack Overflow, by the site's own counter
Total questions shown on stackoverflow.com/questions, archived snapshots, 2009 to 1 Oct 2026
| x | y |
|---|---|
| 1 Jan 2009 | 65.8K |
| 3 Feb 2010 | 489.7K |
| 8 Oct 2011 | 2.1M |
| 2 Jan 2012 | 2.5M |
| 1 Jan 2013 | 4.2M |
| 1 Jan 2014 | 6.4M |
| 1 Jan 2015 | 8.6M |
| 1 Jan 2016 | 10.8M |
| 1 Jan 2017 | 13M |
| 1 Jan 2018 | 15.1M |
| 1 Jan 2019 | 17M |
| 1 Jan 2020 | 18.7M |
| 1 Jan 2021 | 20.6M |
| 1 Jan 2022 | 22.1M |
| 1 Jan 2023 | 23.4M |
| 1 Jan 2024 | 24M |
| 1 Jan 2025 | 24.2M |
| 1 Apr 2025 | 24.2M (peak) |
| 1 Jul 2025 | 24.2M |
| 1 Oct 2025 | 24.2M |
| 1 Jan 2026 | 24.2M |
| 1 Apr 2026 | 24.2M |
| 1 Jul 2026 | 24.1M |
| 1 Oct 2026 | 24.1M |
Second, post ids. Questions and answers draw ids from one sequence, and a deleted post keeps its id, so the ids handed out in a year count everything that was posted, deleted or not. They fell from 6,855,629 in 2014 to 537,410 in 2025: 92%. The visible questions and answers fell 94% over the same years, so deletions explain at most a couple of points of the decline.
Posts created per year, deleted ones included
Post ids issued each calendar year (questions, answers and other post types), from archived snapshots
| Label | Value |
|---|---|
| 2012 | 5.4M |
| 2013 | 6.8M |
| 2014 | 6.9M |
| 2015 | 6.8M |
| 2016 | 6.9M |
| 2017 | 6.6M |
| 2018 | 5.9M |
| 2019 | 5.6M |
| 2020 | 6M |
| 2021 | 5M |
| 2022 | 4.4M |
| 2023 | 2.8M |
| 2024 | 1.6M |
| 2025 | 537.4K (−92% vs 2014) |
Source: host0 analysis of Wayback Machine captures and the Stack Exchange API
Third, other people's counts. A Stack Exchange Data Explorer query reported by ppc.land in August 2026 gives 207,204 for March 2014, within 0.02% of ours. Every version of the number, ours, theirs, the post ids and the counter, says new questions fell by more than 90% since 2014 and by about 99% from the peak to 2026.
Who still answers#
Answers fell almost as far. 3,185,255 answers were posted in 2014 and 187,898 in 2025, a fall of 94.1%; the busiest year was 2013. Between 2022 and 2025, answers fell 89.1% and questions 91.8%, so answering has been holding up slightly better than asking, partly through answers to old questions.
New questions are still less likely to get one. Of the questions asked in October 2025, about a third have no answer at all today.
October questions that still have no answer
Share of each October's questions with zero answers, counted 31 Oct 2026
| Label | Value |
|---|---|
| Oct 2014 | 10.9% (18,738 of 172,631) |
| Oct 2022 | 20.4% (21,520 of 105,743) |
| Oct 2025 | 34.2% (1,798 of 5,263) |
Source: host0 count, Stack Exchange API
What people stopped asking about#
The fall wasn't even across topics. Among ten of the biggest tags, data and front-end tags fell fastest after 2022: pandas questions fell 97.5% and React 96.1%. Rust, C#, Android and TypeScript fell less and gained share. JavaScript, the top tag of 2014 with 11.0% of questions, had 5.6% in 2025.
How far questions fell by tag, 2022 to 2025
Change in questions per calendar year carrying each tag
| Label | Value |
|---|---|
| pandas | −97.5% |
| reactjs | −96.1% |
| javascript | −95.9% |
| python | −94.0% |
| php | −94.0% |
| java | −91.8% |
| typescript | −91.5% |
| c# | −90.6% |
| android | −90.0% |
| rust | −83.5% |
Source: host0 count, Stack Exchange API
You might expect questions about AI tools themselves to fill some of the gap. They didn't. The four main tags for building with language models grew from almost nothing to a peak in 2023, then fell with everything else. Their share of all questions rose until 2024 but never reached 0.7%.
Questions about building with language models
Questions per year tagged openai-api, langchain, large-language-model or huggingface-transformers (summed)
| Label | Value |
|---|---|
| 2022 | 844 |
| 2023 | 3,797 (0.48% of all) |
| 2024 | 2,760 (0.69% of all) |
| 2025 | 723 (0.66% of all) |
Source: host0 count, Stack Exchange API
That fits the research. In a study published in PNAS Nexus in September 2024, del Rio-Chanona, Laurentsyeva and Wachs compared Stack Overflow with Russian- and Chinese-language Q&A sites, where ChatGPT was hard to reach, and with maths forums, where it was weak at the time. Posting on Stack Overflow fell about 25% against them within six months of ChatGPT's launch, which they call a lower bound, with no visible change in how posts were voted. Burtch, Lee and Chen, in Scientific Reports in May 2024, estimated that daily traffic fell by about 1 million people, about 12%, and found no decline in Reddit's developer communities over the same period.
The company found another business#
While the public site emptied, the company's finances improved. Prosus agreed to buy Stack Overflow for $1.8 billion in June 2021 and reports it as its own line. In its results, revenue rose every year from fiscal 2023 to 2026, and a loss turned into a small profit.
Stack Overflow revenue, as reported by Prosus
US$ millions, fiscal years to 31 March, IFRS
| Label | Value |
|---|---|
| FY23 | $94m (aEBIT −$84m) |
| FY24 | $98m (aEBIT −$57m) |
| FY25 | $115m (aEBIT −$22m) |
| FY26 | $129m (aEBIT +$1m) |
Sources: Prosus FY24; FY25; FY26
The money comes from two places that don't depend on public questions. One is the private version of the site for companies, Stack Overflow for Teams, renamed Stack Internal in November 2025; the company said in December 2025 that it "counts over 20,000 customers". The other is licensing the public archive to AI companies. Google Cloud signed in February 2024 and OpenAI in May 2024, and Prosus's fiscal 2025 report says the API "has primarily been responsible for its revenue growth". Neither Prosus nor Stack Overflow breaks revenue down by product.
Prosus has also written down a large part of what it paid. It booked impairments of $374 million in fiscal 2024, "primarily related to Stack Overflow", and $482 million in fiscal 2026 for Stack Overflow and GoodHabitz, which it said were "not performing in line with expectations" after "the disruption caused by generative AI". A slide in its fiscal 2024 results presentation put its return on the investment at −39%.
Stack Overflow since ChatGPT
30 Nov 2022
30 Nov 2022
ChatGPT launches
109,120 questions that month.5 Dec 2022
Jun 2023
Jun 2023
Over a policy limiting removal of AI-generated answers; 1,667 sign the open letter.27 Jul 2023
27 Jul 2023
16 Oct 2023
29 Feb 2024
29 Feb 2024
6 May 2024
6 May 2024
Apr 2025
Apr 2025
Fewer questions than in September 2008
11,385 that month; the site's counter peaks.18 Nov 2025
18 Nov 2025
10 Jun 2026
Source: Stack Overflow announcements, meta posts and host0 counts
The company's own pages tell the same story in what they stopped saying. Its advertising page said "Reach 100 million+ people in tech" until the Wayback Machine's 1 September 2023 capture; from 1 October 2023 it gives no audience size, only "millions". The press release for the 2021 sale said "there is a new question asked on Stack Overflow every 14 seconds". That rate, about 2.25 million a year, matches 2014 to 2016. In 2021 it was one every 21 seconds, by our count. In October 2026 it was about one every 43 minutes.
What developers say#
Stack Overflow's annual Developer Survey asks people how often they visit. It's a self-selected sample, recruited mostly through Stack Overflow's own channels, so it leans towards people who still use the site, and the number of valid responses fell from 89,184 in 2023 to 30,903 in 2026. Even in that group, the share who visit every day has fallen by more than half since 2019.
Developers who visit Stack Overflow daily or more
Share of Developer Survey respondents, 2019 to 2025
| Label | Value |
|---|---|
| 2019 | 60.7% |
| 2020 | 59.1% |
| 2021 | 54.4% |
| 2022 | 53.1% |
| 2023 | 38.2% |
| 2024 | 37.2% |
| 2025 | 24.9% |
In 2026 the survey asked instead how AI had changed the way people use the site.
How AI changed developers' use of Stack Overflow
Share of 2026 Developer Survey respondents who answered the question (n = 16,985; several answers allowed)
| Label | Value |
|---|---|
| Visit less for simple questions | 64.1% |
| Ask fewer questions | 28.9% |
| Contribute less | 26.5% |
| No change | 21.8% |
| Visit more to verify | 15.9% |
| Visit more because AI sends them | 5.7% |
| Contribute more | 1.2% |
Popularity rankings point the same way, with one trap. In the Tranco top-sites list, which averages several traffic sources, stackoverflow.com dropped from 142nd to 366th between the July and August 2023 lists, but that was Tranco changing its sources: GitHub and Reddit dropped at the same time. Within the current method, Stack Overflow went from 366th in August 2023 to 541st on 30 October 2026, most of it between May and July 2025 (364th to 500th). On the same list, chatgpt.com was 112th.
Where the questions went#
If the questions had moved somewhere public, we'd expect to see them. The obvious candidate is GitHub Discussions, where many open-source projects now take questions. We counted discussions created on GitHub each month, and how many were marked as answered. More discussions are being started, but fewer of them end with an answer.
GitHub Discussions marked as answered
Discussions created January to June each year and marked answered, counted Oct 2026
| Label | Value |
|---|---|
| 2023 | 72,247 (of 329,399) |
| 2024 | 67,889 (of 358,673) |
| 2025 | 56,023 (of 376,093) |
| 2026 | 37,990 (of 407,947) |
So GitHub didn't absorb Stack Overflow's Q&A; question-and-answer help shrank there too. Burtch and colleagues found Reddit's developer communities held steady through March 2023, and we found no primary count for Reddit or Discord since. The most likely destination is the one nobody can count from outside: private conversations with ChatGPT, Claude and coding agents. A study co-written by OpenAI researchers found that 4.2% of ChatGPT messages in June 2025 were about computer programming, a small share of an enormous total; we covered the rest in how people use AI chatbots. Stack Overflow seems to read it the same way: its newest product, Stack Overflow for Agents, is built for AI coding agents to search, post and verify answers, with humans reviewing drafts. It has published no usage numbers.
This is the uncomfortable part. The public archive that taught models to answer programming questions is what those answers replaced. A question asked in a chat helps one person. A question asked on Stack Overflow helped everyone who later searched for the same error, and became training data for the next model. The PNAS Nexus authors put it in their title: they asked whether language models are a threat to digital public goods.
What this means if you build with AI#
- Expect fewer public answers for anything new. About 1,000 questions a month now cover every language, framework and tool. A library released this year may have no Stack Overflow thread at all, and an AI model trained on public text may know little about it. Go to the project's docs, changelog and issue tracker first.
- Check what the model tells you. In a 2023 study of 517 Stack Overflow questions, 52% of ChatGPT's answers contained incorrect information, and people missed the errors 39% of the time. That was GPT-3.5, but the habit still pays: 15.9% of those who answered the 2026 survey's question said they now visit Stack Overflow more to verify answers. Run the code, and read the source it cites.
- When you ask in public, make it easy to answer. About a third of October 2025's questions still have no answer, and answers are falling almost as fast as questions. Include a minimal example and what you've already tried.
- Keep your team's answers somewhere searchable. Companies pay Stack Overflow for exactly this; it says Stack Internal has more than 20,000 customers. A small team can get most of it from a shared page of known fixes that everyone, and every agent, can read.
- Know what's being lost. The cost isn't one website. It's the searchable public answers that the next person, and the next model, could find. Each answer that stays in a private chat is one fewer for everyone else.
- Put your answers back. When you or your agent solve something non-obvious, publish it: an answer on Stack Overflow, a comment on the GitHub issue, a short post. If you maintain a project, write the docs, and consider an
llms.txtorAGENTS.mdso models and agents read the current version, not a guess. We looked at who serves llms.txt today.
We build host0 for the step after your agent makes something: a page, a doc or an app goes live at a link, private until you choose to open it up.
Methodology#
We counted questions and answers on 31 October 2026 and re-checked the company, survey and research numbers against their primary pages the same day.
- Questions and answers. Stack Exchange API 2.3, without a key, one request per month from September 2008 to October 2026 plus one for everything before September 2008, using a filter that returns only the total. Dates are creation dates in UTC. Totals are exact counts of questions that still exist (open or closed, any score) on 31 October 2026; deleted questions, migrated questions and unpublished drafts aren't counted. October 2026 runs to about 19:00 UTC on 31 October. Answers are counted per calendar year, to questions of any age.
- Recent months are less certain. For old months our counts match a public Data Explorer count to 0.1%. For August and September 2025 and July 2026 ours are 14–19% lower, as expected when questions are deleted after the fact. But for December 2025 to June 2026 our counts are 24–62% higher than the Data Explorer run that ppc.land reported in August 2026 (for example, 1,986 against 1,229 for May 2026). We don't know why; one candidate is Stack Overflow's newer opinion-based question types, which the two methods may treat differently. That's why we say "about 1,000 a month" for recent months rather than quoting one month as exact.
- Deletions. 68 Wayback Machine captures of stackoverflow.com/questions, about one a quarter from 2009, parsed for the question counter and the newest post id (six readings checked by hand). Post ids are shared by questions, answers and other post types and keep counting through deletions, so ids issued per year measure everything created. Some recent ids may go to posts that were never public; we didn't verify that.
- Unanswered. Questions with zero answers, from the API's no-answers endpoint. Stack Overflow's cleanup removes unanswered, zero-score questions after about a year, so the shares for older months are floors.
- Tags. Current tags, one tag per request, calendar years 2014, 2022 and 2025 (and 2023–2024 for the AI tags). A question can have five tags, so shares overlap.
- Company. Revenue and adjusted EBIT are from Prosus's results for fiscal years ending 31 March, in US dollars under IFRS. We don't attribute Prosus's fiscal 2023 impairment to Stack Overflow; its report doesn't. Customer and corpus numbers are the company's own claims.
- Survey. Stack Overflow Developer Survey results pages, 2019–2026. "Daily or more" sums two answer options. Respondents are recruited mostly through Stack Overflow's own channels, so the sample over-represents its users. The 2026 survey reworded its question about trust in AI, so we don't compare it with earlier years.
- Tranco. The list on the first of each month from March 2019, plus 30 October 2026. Its traffic sources changed in September 2020, May 2022 and August 2023, so ranks are only compared within one period.
- GitHub Discussions. Monthly counts from GitHub's GraphQL search (all, answered, at least one comment). The index holds only discussions that still exist, "answered" exists only in Q&A categories, and March and October 2026 show unexplained spikes, which is why we compare January to June windows.
The data pack, with every source, tier, conflict between sources and a do-not-cite list, is in our repository at docs/research/2026-10-31-stack-overflow-decline.md. The scripts and the series behind every chart are in docs/research/2026-10-31-stack-overflow-decline-data/.
Open questions#
- Why do the recent counts disagree? Our December 2025 to June 2026 months are well above an August 2026 Data Explorer run. Counting the opinion-based question types separately would settle whether they explain it.
- What is being deleted? At least 193,000 older questions disappeared between April 2025 and October 2026. We found no announcement of a cleanup.
- Where does the revenue come from? Prosus credits Teams and the data API but never splits revenue by product, and the price of the licensing deals isn't public.
- Will agents ask in public? Stack Overflow for Agents is a bet that AI agents will post and verify answers where people once did. Nobody has published how many do.
- Where did the questions go? Into private chats, almost certainly, but no public number measures how many programming questions people now ask AI instead.