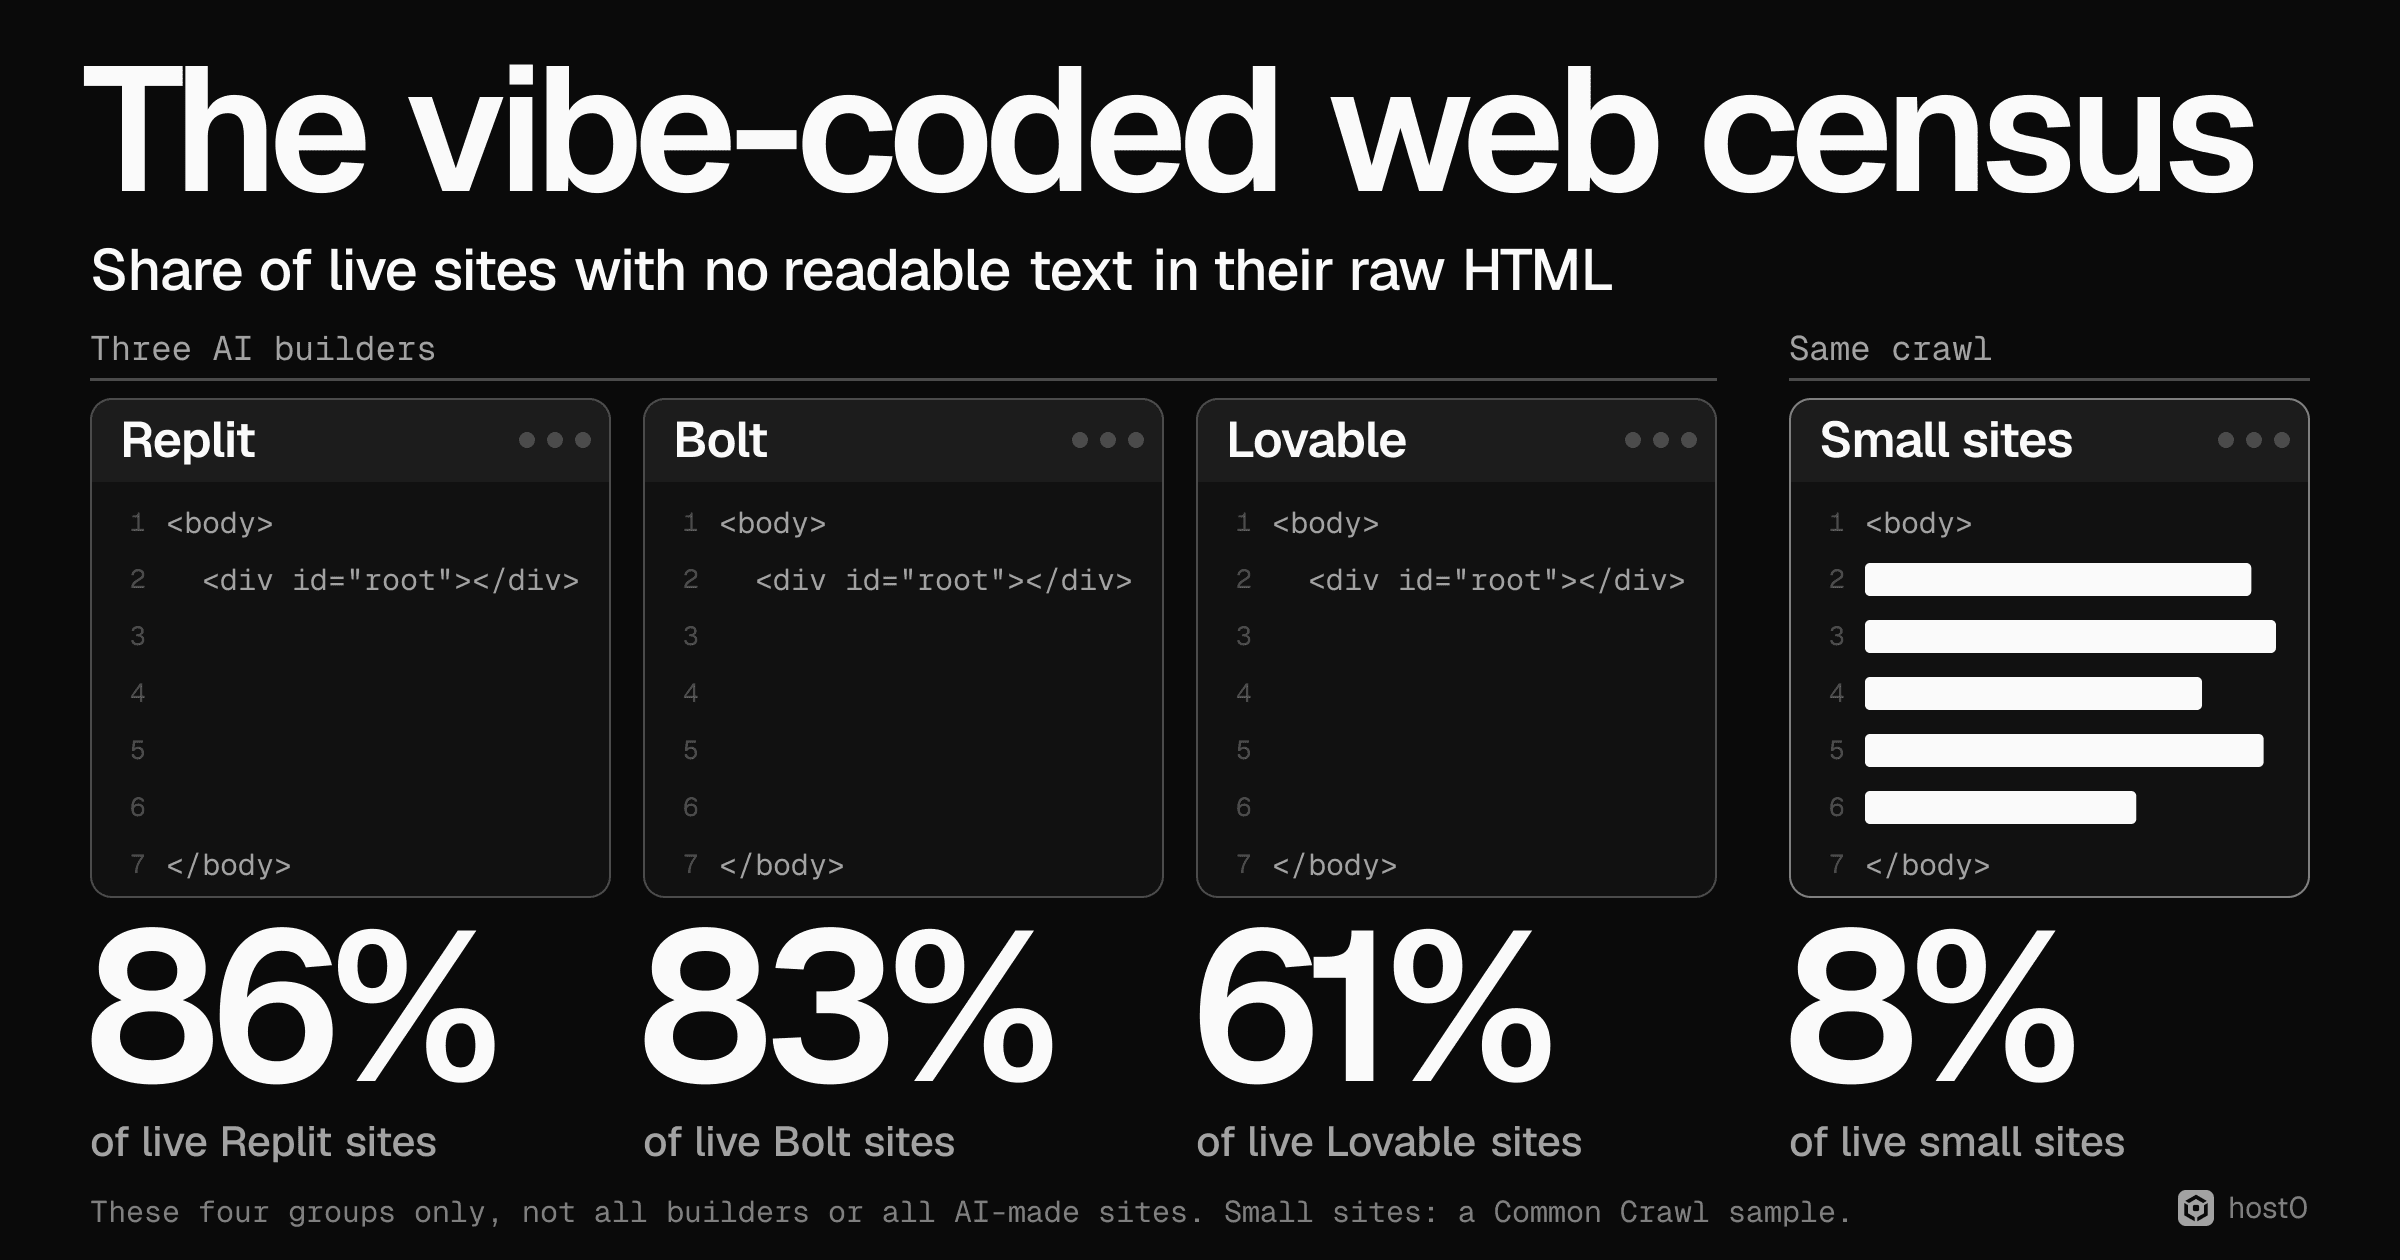
Are sites built on AI app builders slower, less accessible or worse for search than ordinary sites? On 5 November 2026 we crawled 9,264 hosts to find out: random samples from Lovable, Replit, Base44, Bolt and v0, Framer as a no-code comparison, and four control groups. 7,435 of them gave us a home page we could score, and 906 of those also went through Lighthouse. The short answer: in lab scores, not slower than ordinary small sites and about the same on accessibility. In raw HTML, far emptier on Replit, Bolt and Lovable's older template, which matters to anything that doesn't run JavaScript. We didn't measure rankings or indexing, so we can't say whether that costs anyone traffic.
The raw HTML gap held up under every check we ran: other text thresholds, leaving out stubs, reading pages by hand. 86% of live Replit apps, 83% of Bolt sites and 61% of Lovable sites send no readable text in their HTML, against 8% of small sites from the same crawl. The numbers describe sites built on each platform, a mix of template, hosting and the person behind them, so nothing here says AI made a site better or worse. The methodology explains how we did it and where it falls short.
Key findings
- 1Most pages on three builders arrive empty. 86.4% of Replit's 697 live pages, 82.9% of Bolt's 210 and 61.0% of Lovable's 957 have under 50 characters of body text in the HTML the server sends. Small sites from the same crawl: 8.3%. Once JavaScript runs, most of these pages fill in.
- 2Lighthouse's SEO score can't see it. It reads the rendered page. 155 of 203 such pages from Lovable, Replit and Bolt (76%) score 90 or more on it.
- 3It follows the template. On a client-only template, developer subdomains, where people deploy their own code, are empty 91.8% of the time (123 of 134), next to Replit's 96.2%. They just use that template far less: 14.8% of them against Replit's 87.2%. Some of those sites may be AI-built too; we can't tell.
- 4One platform shows both sides. Lovable pages without a TanStack marker are 97.7% empty. Pages with it are 7.5% empty. Lovable says new projects have been server-rendered since 13 May.
- 5Not slower than small sites, and the lead isn't theirs alone. The five AI builders and Framer all beat small sites on median Lighthouse performance, a lab score, by 14 to 35.5 points. Developer subdomains beat them by 30. Against those, only v0 is ahead.
- 6Accessibility is about the same. Medians run from 85 to 95. Lovable and v0 lead small sites by 5 points, and the other builders are level. The outlier looks like one template: 80.5% of Replit pages block pinch-zoom.
- 7Base44 ships text only a crawler sees. 99.9% of its pages have no visible text in the raw HTML, and 87.7% ship a block clipped to 1px that a crawler can read. A simple empty-HTML test scores it well and misses this.
- 8One Replit robots file blocks crawlers. 20.5% of Replit's live or robots-blocked hosts (180 of 878) serve a rule that shuts out all crawlers except named social-preview bots. All 40 we compared were byte-identical. We don't know what triggers it.
86%
Of live Replit apps send no readable text in their HTML. Bolt 83%, Lovable 61%, small sites 8%
Source: host0 crawl, 5 Nov 2026
155 of 203
Empty pages from Lovable, Replit and Bolt that still score 90+ on Lighthouse SEO
Source: host0 analysis
97.7% vs 7.5%
Empty HTML on Lovable, without and with a TanStack marker
Source: host0 analysis
91.8%
Empty HTML on developer subdomains using a client-only template (123 of 134)
Source: host0 analysis
What we compared#
Each builder group is hosts on its default domain, drawn from Common Crawl. Bolt means *.bolt.host only, not Bolt sites deployed anywhere else, and v0 means hosts named v0-*.vercel.app. There are four controls. Developer subdomains are sites on vercel.app, netlify.app and github.io, the nearest thing to hand-deployed JavaScript sites, though some are probably built with AI tools we can't identify. Small sites are random hosts with few Common Crawl captures, found the same way as the builder lists, which makes them the fairest control. Tranco 500k-1M and Tranco top 10k come from a public popularity ranking.
"Live" means a home page we could score. Dead hosts, login pages, bot challenges and off-site redirects are out, and so are hosts whose robots.txt told us not to fetch, including 181 on Replit. Each percentage below is a share of that group's scoreable pages unless it says otherwise.
Home pages with no readable text in the raw HTML
Share of live pages, under 50 characters of body text on a page with scripts, 5 Nov 2026
| Label | Value |
|---|---|
| Replit | 86.4% (83.6–88.7) |
| Bolt (bolt.host) | 82.9% (77.2–87.4) |
| Lovable | 61% (57.9–64.1) |
| Developer subdomains | 19.2% (16.8–21.9) |
| Base44 | 12.7% (10.7–15.1) |
| v0 (v0-*.vercel.app) | 11.5% (9.6–13.7) |
| Tranco 500k-1M | 11.5% (9.1–14.4) |
| Small sites (Common Crawl) | 8.3% (6.6–10.5) |
| Tranco top 10k | 5.8% (4.1–8.2) |
| Framer | 1.1% (0.6–2.0) |
Source: host0 crawl of 9,264 hosts
A page like this isn't broken. The server sends an empty container and a script, and the script builds the page in the browser. People with a working browser see a normal site. What changes is what anything that doesn't run JavaScript receives, because it gets the empty container and nothing else.
We read 30 of these pages by hand in the builder groups and developer subdomains, and all 30 held no readable content: an empty root div, a badge string, a loading string or a hidden SEO block. The 8.3% for small sites is, if anything, high. 5 of the 15 control pages we read turned out to be stubs with no body content, such as a JavaScript redirect, and if stubs don't count as empty, small sites fall to 2.5%.
It follows the template, not the builder's name#
The obvious explanation is that AI writes poor HTML. This data can't test AI directly, but it does show that the emptiness isn't particular to the builder platforms. Group the pages by the kind of template they're built on, and every group that uses a client-only single-page template in numbers looks alike, from 91.8% to 98.7% empty, including developer subdomains, where people deploy their own code.
Empty HTML among pages on a client-only template
Share with no readable text, pages detected as a client-only SPA template
| Label | Value |
|---|---|
| Lovable | 98.7% (551 of 558) |
| Replit | 96.2% (585 of 608) |
| Bolt | 95.5% (171 of 179) |
| Developer subdomains | 91.8% (123 of 134) |
Source: host0 crawl
A client-only page is close to empty by design, so the high rates aren't a surprise. What separates the groups is how many of their sites use that template, and on a builder that's largely the builder's choice.
Lovable shows both sides#
Lovable gives the cleanest test, because one platform has two templates live at once. Lovable says, in a post dated 1 June 2026, that new projects are server-rendered on TanStack Start from 13 May, while existing projects keep working as before. We can see that split in the wild: 389 of the 957 live pages (40.6%) carry a TanStack marker.
Lovable pages with no readable text, by template marker
Share of live Lovable pages, 5 Nov 2026
| Label | Value |
|---|---|
| No TanStack marker | 97.7% (555 of 568) |
| TanStack marker | 7.5% (29 of 389) |
Source: host0 crawl
Same platform, opposite result, though it isn't a controlled test. Inside Lovable the two kinds of page show no clear gap in lab speed: median Lighthouse performance is 93 [84, 97] on empty pages and 89.5 [80, 94] on pages with text, with 49 and 42 sites, a gap under our noise floor. Across all groups, our model links client-only rendering to about 4.6 fewer points [1.9, 7.4] once page weight is accounted for.
Base44 needs its own explanation#
Base44 looks fine on the first chart and strange on every closer look. 99.9% of its pages (910 of 911) have no visible text in the raw HTML. But 87.7% (799 of 911) ship a block clipped to 1 pixel, marked data-seo-source="builder", with an h1, a description and usually page links in it. A person never sees that block, and a crawler can read it. No other group has it.
What Base44 sends in its raw HTML
Share of 911 live Base44 pages, 5 Nov 2026
| Label | Value |
|---|---|
| No visible text | 99.9% (910 of 911) |
| A 1px block a crawler can read | 87.7% (799 of 911) |
| No text, even counting hidden | 12.7% (116 of 911) |
Source: host0 crawl
So Base44 has text for a crawler and an empty page for a person until the script runs. Whether search engines treat that block as page content is something we didn't test.
Lighthouse's SEO score can't see any of this#
These are real sites. Of the 203 client-only pages from Lovable, Replit and Bolt in our Lighthouse sample, 181 (89%) hold 200 or more characters once JavaScript runs. With Base44 it's 259 of 283. The h1 shows the gap well: mostly missing from the HTML, mostly there after rendering.
Pages with an h1, in raw HTML and after JavaScript
Share of the Lighthouse sample per builder; visible h1 only
| Label | Value |
|---|---|
| Lovable, raw | 40.7% (37 of 91) |
| Lovable, rendered | 87.9% (80 of 91) |
| Replit, raw | 17.5% (17 of 97) |
| Replit, rendered | 79.4% (77 of 97) |
| Bolt, raw | 14.1% (13 of 92) |
| Bolt, rendered | 85.9% (79 of 92) |
| Base44, raw | 1.2% (1 of 81) |
| Base44, rendered | 91.4% (74 of 81) |
Source: host0 analysis
That's why the usual check doesn't catch it. Lighthouse scores the rendered page, so a page that's empty on the wire can score well. Replit's docs say the platform runs a Lighthouse audit after every successful publish, which makes this blind spot worth knowing about.
Client-only pages scoring 90+ on Lighthouse SEO
Pages with no visible text in the raw HTML, Lighthouse sample
| Label | Value |
|---|---|
| Lovable | 100% (49 of 49) |
| Base44 | 93.8% (75 of 80) |
| Replit | 72.4% (55 of 76) |
| Bolt | 65.4% (51 of 78) |
Source: host0 analysis
What we can and can't say about search#
Whether an empty page matters depends on who's reading it. Google renders JavaScript, and so does Applebot. In a study Vercel published with MERJ in December 2024, "none of the major AI crawlers currently render JavaScript", naming crawlers from OpenAI, Anthropic, Meta, ByteDance and Perplexity. That finding is nearly two years old and may have changed.
There's one important exception for Lovable. Lovable says that existing projects gain pre-rendering, and that a verified crawler gets rendered HTML while people get the single-page app. We didn't test that, because it would take a spoofed crawler identity and our rules forbid one. So the Lovable figure is what a browser, a scraper or an unverified bot receives before any JavaScript runs, and we don't know what Googlebot receives.
We measured the HTML, not outcomes. Nothing in this post says any of these sites rank lower, are indexed less or get less traffic.
Speed: a lead over small sites that developers share#
Median Lighthouse performance runs from 56.5 to 98.5. These are lab scores on mobile defaults with simulated throttling, not what real visitors get.
Median Lighthouse performance score
Mobile defaults, 72 to 100 sites per group, 5 Nov 2026
| Label | Value |
|---|---|
| v0 (v0-*.vercel.app) | 98.5 (97–99) |
| Developer subdomains | 93 (89.5–95) |
| Lovable | 91 (86–94) |
| Bolt (bolt.host) | 85.5 (80–90.5) |
| Framer | 82 (77–86) |
| Replit | 79 (73–86) |
| Base44 | 77 (73–83) |
| Small sites (Common Crawl) | 63 (57.5–67.5) |
| Tranco top 10k | 57 (49–68) |
| Tranco 500k-1M | 56.5 (54–60.5) |
Source: host0 analysis, Lighthouse 13.6.0
Against small sites, every builder leads. Set the developer subdomains beside them, though, and the lead stops looking like a builder effect. Self-deployed JavaScript sites on hosting platforms have it too.
Lead over small sites, median Lighthouse performance
Difference of medians in points, with 95% intervals in the notes
| Label | Value |
|---|---|
| v0 | +35.5 (30.5–41) |
| Developer subdomains | +30 (23.5–35.5) |
| Lovable | +28 (20–35) |
| Bolt | +22.5 (15.5–29) |
| Framer | +19 (12–24.5) |
| Replit | +16 (9.5–25) |
| Base44 | +14 (7.5–20.5) |
Source: host0 analysis
Gap to developer subdomains, median Lighthouse performance
Difference of medians in points. Bar length is the size of the gap, the sign its direction
| Label | Value |
|---|---|
| v0 | +5.5 (2 to 9) |
| Lovable | −2 (−8 to 3.5) |
| Bolt | −7.5 (−13 to −1.5) |
| Framer | −11 (−16 to −6) |
| Replit | −14 (−19 to −5.5) |
| Base44 | −16 (−21.5 to −10) |
Source: host0 analysis
Page weight goes with part of the gap. The median page on small sites weighs 2,847 KB, against 954 KB on Lovable and 394 KB on developer subdomains, and adding weight to our model shrinks the leads over small sites by 14% to 40%. 39.6% of small sites are WordPress, so hosting and plugins may sit in that difference too.
Median page weight
Kilobytes transferred on load, Lighthouse sample
| Label | Value |
|---|---|
| v0 | 379 KB |
| Developer subdomains | 394 KB |
| Bolt | 487 KB |
| Lovable | 954 KB |
| Replit | 954 KB |
| Base44 | 991 KB |
| Framer | 1,418 KB |
| Small sites | 2,847 KB |
| Tranco top 10k | 2,987 KB |
| Tranco 500k-1M | 3,716 KB |
Source: host0 analysis
Adjusting for page weight and client-only rendering together shrinks most of the leads over small sites and removes none, and developer subdomains fall the most. Base44's edges up, because nearly all its pages take the client-only penalty.
Lead over small sites after adjusting for weight and rendering
Regression coefficient in performance points; raw coefficient in the notes
| Label | Value |
|---|---|
| v0 | +20.6 (raw +27.9) |
| Lovable | +20.5 (raw +22.7) |
| Bolt | +15.5 (raw +19.6) |
| Replit | +14.8 (raw +15.2) |
| Framer | +14.5 (raw +17.2) |
| Developer subdomains | +13.7 (raw +21.8) |
| Base44 | +13.4 (raw +12.4) |
Source: host0 analysis, 906 sites
Two more checks keep this modest. Among the lightest pages, under 557 KB, the lead mostly goes away: v0 100, Lovable 98, Bolt 93, Replit 92 and Base44 88, against small sites 96.5 and both Tranco groups 97.5, though with only 8 to 10 control sites each. And untouched starter pages flatter a group's median. Where the title and description have both been changed, Lovable's median is 88 rather than 91, v0's is 98 and Framer's is 79.5. In the same lab runs, median Largest Contentful Paint was 1.3 s on v0, 3.0 to 4.9 s on the other builders and developer subdomains, and 6.3 to 8.3 s in the other controls, again simulated throttling on a loaded machine, not field data.
Accessibility: about the same, with one template problem#
Lighthouse accessibility medians sit close together. Lovable and v0 lead small sites by 5 points [2.5, 7] and [1, 7]. The rest are level: Bolt +2.5 [−1.5, 5], Base44 0 [−5, 3], Framer 0 [−4, 2], Replit −2 [−5, 1], developer subdomains +1.5 [−2, 4.5].
Median Lighthouse accessibility score
72 to 100 sites per group, 5 Nov 2026
| Label | Value |
|---|---|
| Lovable | 95 (95–96) |
| v0 | 95 (93–96) |
| Bolt | 92.5 (90–95) |
| Developer subdomains | 91.5 (88–94) |
| Tranco top 10k | 91 (86–94) |
| Base44 | 90 (87–93) |
| Framer | 90 (87.5–91.5) |
| Small sites | 90 (88.5–93) |
| Replit | 88 (87–90) |
| Tranco 500k-1M | 85 (80.5–89) |
Source: host0 analysis
Failures follow templates here too. Colour contrast fails nearly everywhere, on 45.0% to 74.1% of pages in every group, including 50.6% of the Tranco top 10k, so it isn't a builder problem. The specific ones are more telling:
- Base44: 45.7% have a button with no accessible name.
- Framer: 47.0% miss a page language, and 43.0% have a link with no name.
- Tranco 500k-1M: 58.0% have a link with no name, and 31.8% an image with no alt text.
- Replit: the viewport tag.
That last one stands out. 80.5% of Replit pages (561 of 697) set a viewport tag that blocks pinch-zoom in browsers that honour it, a real barrier for people with low vision. On the other builders and developer subdomains it's 0% to 4.6%. axe flags it on 75.3% of Replit's Lighthouse sample.
Pages that block pinch-zoom in the viewport tag
Share of live pages, raw HTML
| Label | Value |
|---|---|
| Replit | 80.5% (561 of 697) |
| Tranco 500k-1M | 15.5% (89 of 574) |
| Tranco top 10k | 15.5% (80 of 515) |
| Small sites | 13.7% (104 of 758) |
| Developer subdomains | 4.6% (42 of 907) |
| v0 | 4.2% (38 of 915) |
| Bolt | 3.3% (7 of 210) |
| Lovable | 1.5% (14 of 957) |
| Base44 | 0.9% (8 of 911) |
| Framer | 0% (0 of 991) |
Source: host0 crawl
Automated tools catch only part of accessibility, so treat all of these as a floor.
The robots file served identically across Replit#
20.5% of Replit's live or robots-blocked hosts (180 of 878) [18.0, 23.3] serve a rule that blocks all crawlers and allows named social-preview bots. We compared 40 of those files and all 40 were byte-identical, as were 12 of 12 in an earlier sample, so they share one source, most likely the platform or something it generates. We don't know what triggers it, and we measured the file, not what search engines did with it. Replit's SEO score page recommends a robots.txt and doesn't mention a block-all rule.
Hosts whose robots.txt blocks crawlers by default
Catch-all rule disallows the home page. Share of live or robots-blocked hosts, 5 Nov 2026
| Label | Value |
|---|---|
| Replit | 20.5% (180 of 878) |
| Tranco 500k-1M | 9.5% (61 of 642) |
| Tranco top 10k | 7.2% (40 of 559) |
| Base44 | 2.9% (27 of 938) |
| Small sites | 2.1% (16 of 776) |
| Developer subdomains | 0.8% (7 of 919) |
| Lovable | 0.4% (4 of 961) |
| Bolt | 0% (0 of 210) |
| v0 | 0% (0 of 918) |
| Framer | 0% (0 of 991) |
Source: host0 crawl
Search basics in the raw HTML#
The tags in the head of the page tell a mixed story, and template decisions show up again. Here's the meta description, leaving out builders' default text.
Pages with a meta description that isn't a default
Share of live pages, raw HTML, builder default text excluded
| Label | Value |
|---|---|
| Base44 | 94.1% |
| Lovable | 89.4% |
| Tranco top 10k | 87.4% |
| Framer | 83.6% |
| Tranco 500k-1M | 80.3% |
| v0 | 76% |
| Replit | 62.8% |
| Small sites | 61.1% |
| Bolt | 57.1% |
| Developer subdomains | 54.5% |
Source: host0 crawl
- Canonical tag: Framer 99.4% and Base44 89.5% against Lovable 24.7%, Bolt 23.8%, Replit 7.3% and v0 5.5%. Small sites have it on 70.7%, Tranco 64.6% to 75.7%.
- Noindex: Base44 12.8% (117 of 911) and Framer 9.2% (91 of 991). 77 of Framer's are every
framer.apphost we sampled, so that domain looks platform-wide. Every other group is at or under 3.2%. We measured the request, not what search engines did with it. - Raw title: nearly universal. Replit is the low, at 86.9%.
Builder defaults left in place#
Some sites never changed the words the builder gave them. These strings are the builders' own: the v0 pair sits on one in five sites.
Pages still carrying a builder's default text
Share of each builder's live pages, raw HTML
| Label | Value |
|---|---|
| "v0 App" + "Created with v0" | 21.7% (199 of 915) |
| "Made with Framer" | 14.9% (148 of 991) |
| "My Framer Site" | 10.8% (107 of 991) |
| "Lovable Generated Project" | 9.3% (89 of 957) |
| "Lovable App" | 5.3% (51 of 957) |
Source: host0 crawl
Security headers follow the host#
These measure one normal response, so they aren't a security test and we don't rate any group on them. They're still useful as a picture of who sets the defaults. HSTS is on all of every builder's pages, and that's the hosting platform at work.
Pages sending HSTS
Share of live pages answering on HTTPS
| Label | Value |
|---|---|
| Lovable | 100% |
| Replit | 100% |
| Base44 | 100% |
| Bolt | 100% |
| v0 | 100% |
| Framer | 100% |
| Developer subdomains | 97.8% |
| Tranco top 10k | 57.9% |
| Tranco 500k-1M | 38.9% |
| Small sites | 35.6% |
Source: host0 crawl
Pages with a real Content-Security-Policy
Share of live pages, more than a frame-ancestors rule, one response
| Label | Value |
|---|---|
| Tranco top 10k | 21.7% |
| Tranco 500k-1M | 19.9% |
| Small sites | 11.7% |
| Replit | 1.4% |
| Bolt | 1.4% |
| Developer subdomains | 1.2% |
| v0 | 0.3% |
| Lovable | 0.1% |
| Base44 | 0% |
| Framer | 0% |
Source: host0 crawl
Other headers split the same way. x-content-type-options and referrer-policy are on 100% of Lovable and Base44 pages, 100% and 0% on Framer, and about 1% to 8% on Replit, Bolt and v0.
What this means if you build with AI#
- Look at what your server sends, not what your browser shows. Run
curl -s https://your-site.example | grep -i "<h1", or use View Source rather than the inspector. If the h1 isn't there, neither is your text for anything that doesn't run JavaScript. - Don't take a Lighthouse SEO score as the answer. 76% of the empty Lovable, Replit and Bolt pages we tested score 90 or more. It's a useful check of the rendered page and silent on this question.
- If search or AI crawlers matter, ask your agent for server rendering or pre-rendering. For empty HTML, in this data, the template matters far more than the builder's name. If you own a site, Google's Search Console shows what Google actually fetched, which is the test we couldn't run.
- If you're on Replit, check two files. Open
/robots.txton your published app, and read the viewport tag. If it's set tomaximum-scale=1oruser-scalable=no, remove it so that people can zoom. - Replace the defaults. Change the title and description before you share the link. One in five v0 sites still says "v0 App".
- Fix the template's accessibility misses. Name your buttons and links, set a page language, and check contrast. Run axe once on your home page, and remember that it catches only part of the problem.
- Keep pages light. Of everything we modelled, page weight had the clearest link to performance scores: about 14.7 points per ten-fold increase.
- Set your own headers if you handle anything sensitive. A hosting default of HSTS doesn't cover a Content-Security-Policy, and an app with logins or payments needs more thought than a brochure page.
Agents can build a site in an afternoon, and how it renders is still a decision someone has to make. We built host0 to give what they make a link you can share, private until you say otherwise; we didn't measure it here, and a client-only app is just as empty on it.
Related: how long these apps last, in personal software by the numbers; where they're hosted, in the state of AI app hosting; and a harder look at their data, in vibe-coded app security.
Methodology#
We crawled on 5 November 2026, from about 17:14 to 19:17 GMT. All numbers are group medians or shares. We publish no site names, URLs or per-site scores.
- Lists. Up to 1,000 random hosts per group. Lovable, Replit, Base44, Bolt, v0, Framer, developer subdomains and small sites come from Common Crawl's index; Tranco from list JZPGY, fetched on the crawl day, ranks 1 to 10,000 and 500,001 to 1,000,000. Bolt is the whole frame, all 264
*.bolt.hosthosts in 13 crawls. Small sites have at most 50 captures, one per registrable domain, drawn from 250 random index blocks. Developer subdomains are 45%vercel.app(notv0-), 45%netlify.appand 10%github.io. We dropped 17 control sites carrying a builder marker, 15 of them scoreable. - v0 and Bolt identification. v0 is identified by host name:
v0-*.vercel.app, plus 5 Vercel hosts with a v0 generator tag. 790 of the 910 name-matched sites keep a v0 tag, a floor of 87%, and 24 of 25 of the rest looked consistent by hand. It can include people who named a projectv0-themselves. Bolt on Netlify was dropped because it can't be identified: 0 of 450 samplednetlify.apphosts carried a Bolt marker, so any such sites sit unlabelled in the developer-subdomain control. - Raw HTML. Up to one GET of each home page, 9,264 hosts, as
host0-research/1.0, over HTTPS only, with robots.txt read first and a disallow respected. An HTTP-only site counts as dead by connection, which falls mostly on the small-site and Tranco lists. 3 MB cap, 40 s limit, at most 3 requests a second per group. 7,435 pages were scoreable. Besides the 15 dropped control sites, the rest were excluded: dead by connection 590, dead by HTTP 377, blocked by robots 357, off-site redirect 160, bot challenge 134, forbidden 70, login 44, empty 29, platform dead page 24, non-HTML 17, parked 12. - No text. Under 50 characters of body text, hidden blocks included, on a page with scripts. Results are stable above that: at 50 / 200 / 500 characters of visible text, Replit is 86.4 / 87.7 / 91.0, Bolt 82.9 / 83.3 / 86.7, Lovable 61.0 / 63.3 / 65.6 and small sites 8.3 / 10.3 / 15.0. Hand reads confirmed 30 of 30 client-only pages in builder groups and developer subdomains, and 25 of 25 pages with text. 8.3% is on the high side: if stubs with no body content don't count as empty, small sites are at 2.5%, and the builders barely move.
- Client-only template. A Vite, Create React App or Angular marker in the raw HTML, with no marker of a CMS or a server-rendering framework. One of those markers is itself an empty root div, so we re-ran the comparison on the script-based markers alone: developer subdomains 91.9% (114 of 124), and Lovable, Replit and Bolt unchanged at 98.7%, 96.2% and 95.5%.
- Lighthouse and axe. Lighthouse 13.6.0, mobile defaults, simulated throttling, Chrome 156 headless, fresh profile per run, groups interleaved. axe-core 4.14 (WCAG 2.0/2.1 A and AA) ran on a second, fresh load. 906 first runs scored, 72 to 100 per group against a target of 100 to 150, so small differences don't carry far. 12 more hit bot challenges. We never solved a challenge, in either stage, and used no stealth flags.
- Intervals. Brackets and interval notes are 95%: Wilson for shares, a bootstrap with 2,000 resamples for medians and differences of medians, and a bootstrap over sites for the model.
- Noise. On 31 sites with three runs, performance varied by a median of 3 points (90th percentile 7), and accessibility and SEO not at all. Gaps under about 5 performance points aren't meaningful.
- Machine load. The machine was shared with other work. When we re-ran 17 sites alone, performance rose by a median of 4 points [0, 11], and LCP, accessibility and SEO didn't change. So absolute performance runs a little low. Groups shared the load, so comparisons hold. We don't report Total Blocking Time, which load inflates.
- Selection bias. Builder groups are default-domain hosts only. Sites on a custom domain, plausibly the more serious ones, aren't measured. Common Crawl favours sites someone linked to, and everything we scored had survived until November. Some groups mix older crawls with the newest, and Bolt moves with it: 97.1% with no visible text for hosts in the October 2026 crawl, 68.6% for older-only hosts. Controls include gambling spam and thin pages; we didn't filter by quality.
- Mistakes in the crawl. A bug made about 1,540 hosts get a second home-page GET after a restart, and we made about 80 extra robots.txt fetches for the identical-file check. A stray set of old workers ran 189 extra Lighthouse runs with different Chrome flags: they're excluded from every score, though they added machine load. 57 early runs from a broken setup were discarded. A Bolt marker regex wrongly matched a Wix string on 44 small sites; we fixed it, and those sites are back in the raw-HTML numbers but weren't eligible for the Lighthouse sample, so that sample is slightly short of Wix. 13 bot walls answering 200 were moved to challenges after hand checks.
- Limits. The scores measure home pages only, from one machine on one network, so distance to each host's servers plays a part. Security headers come from one response. Lab scores aren't field data. As a rough check, the controls look ordinary against the HTTP Archive's Web Almanac 2025: a median Lighthouse accessibility score just over 85, a meta description on 67.2% of mobile pages and Content-Security-Policy adoption of 21.9%. It's a different sample and different page types, so that's context only.
Not every list answered, and these shares aren't a survival rate: the lists are survivors already, their ages differ, and Tranco lists many domains that serve no HTTPS site.
The data pack, with every source, the crawl mistakes and a do-not-cite list, is in our repository at docs/research/2026-11-05-vibe-coded-web.md. The series and scripts are in docs/research/2026-11-05-vibe-coded-web-data/. It holds no host lists, raw HTML or per-site results.
Open questions#
- What do Googlebot and verified crawlers actually receive from Lovable? This needs Search Console access from a site owner, not a spoofed crawler.
- What triggers Replit's block-all robots file? The file is identical across hosts. What's behind it isn't documented on the page we read.
- How do custom-domain sites compare? We have no defensible list of them. Builder markers in the small-site sample are too few (8 of 766).
- Will Lovable's older sites migrate? A re-crawl in a few months would show whether the 59.4% without the marker shrinks.