KPI dashboard
A clean metrics page from a spreadsheet, with charts and a month filter.
Built with Claude CodeClaude Opus 5.5verified Oct 2026Pages & files
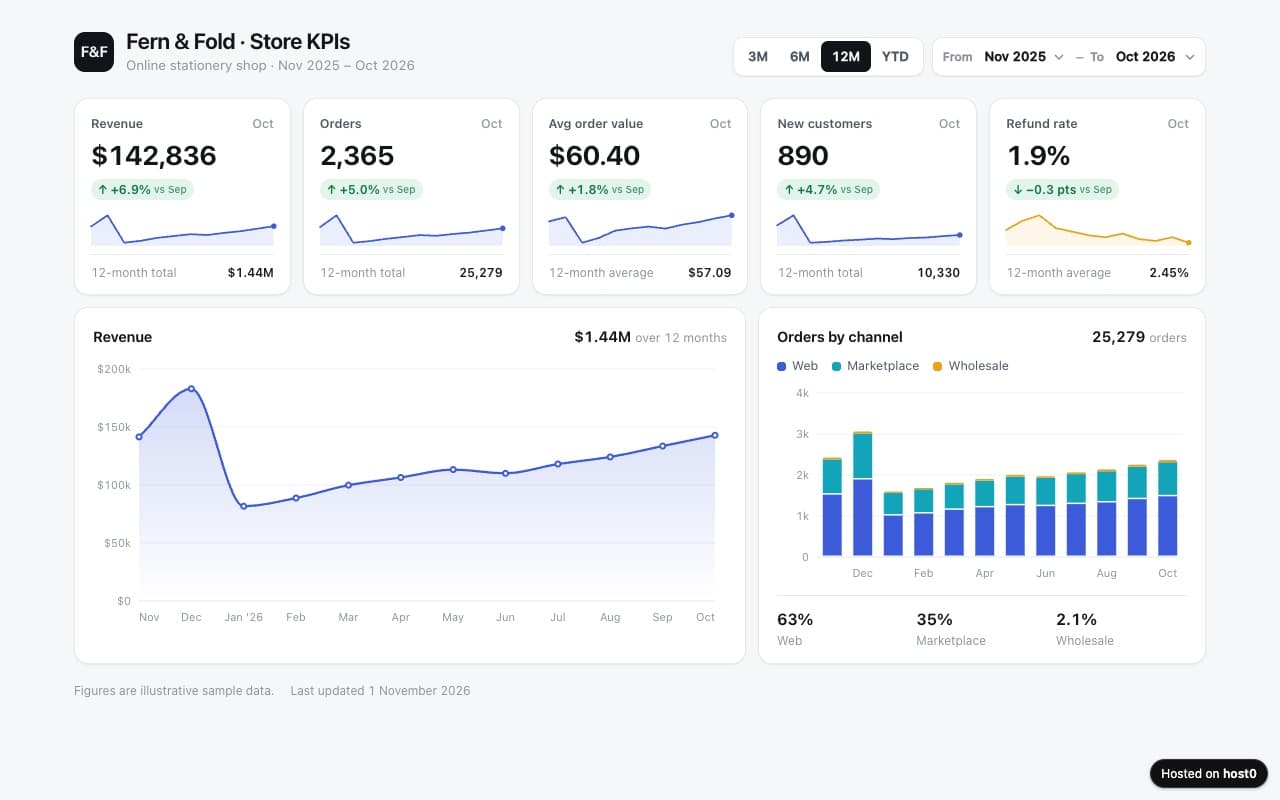
Change the month range and watch the tiles and charts update.
The prompt
Build a one-page KPI dashboard for a small online shop from this data (make up 12 months of realistic numbers for: revenue, orders, average order value, new customers, refund rate). Show KPI tiles with change vs last month, a revenue line chart, orders by channel (web, marketplace, wholesale) as bars, and a month range filter. Draw the charts with inline SVG, no chart library; it must look good on a phone. One HTML file. Keep the bottom-right corner free. Publish it with host0 as a link anyone can open — follow https://host0.ai/skill.md.
claude 'Build a one-page KPI dashboard for a small online shop from this data (make up 12 months of realistic numbers for: revenue, orders, average order value, new customers, refund rate). Show KPI tiles with change vs last month, a revenue line chart, orders by channel (web, marketplace, wholesale) as bars, and a month range filter. Draw the charts with inline SVG, no chart library; it must look good on a phone. One HTML file. Keep the bottom-right corner free. Publish it with host0 as a link anyone can open — follow https://host0.ai/skill.md.'What you get
- A dashboard page you can send as a link
- KPI tiles, a line chart and bars
- A month range filter
- No chart library — loads instantly
What it shows on host0
Make it yours
Send one of these next, in the same conversation.
- Read the numbers from a data.csv file next to the page instead.
- Make it private and invite my cofounder.
- Add a dark mode toggle.
More examples
All examples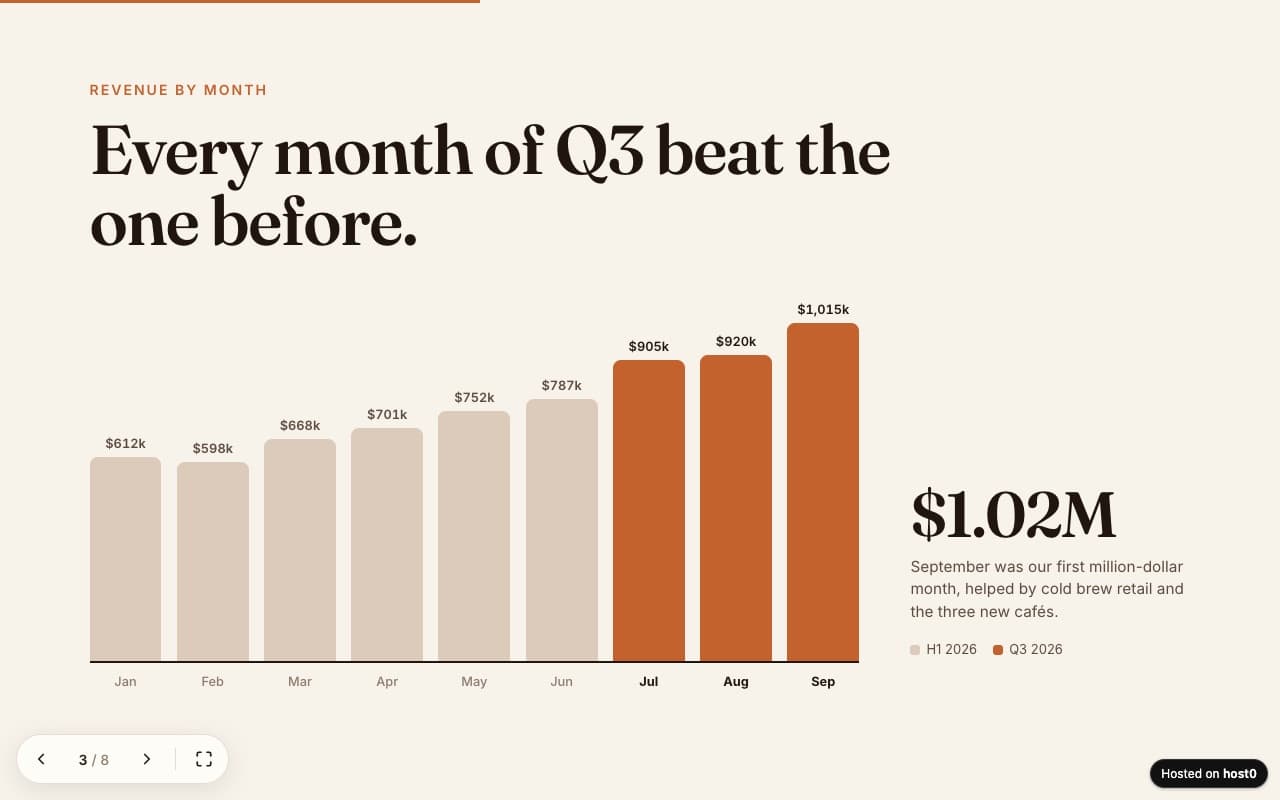
A presentation as one web page — arrow keys, swipe and a link to send.
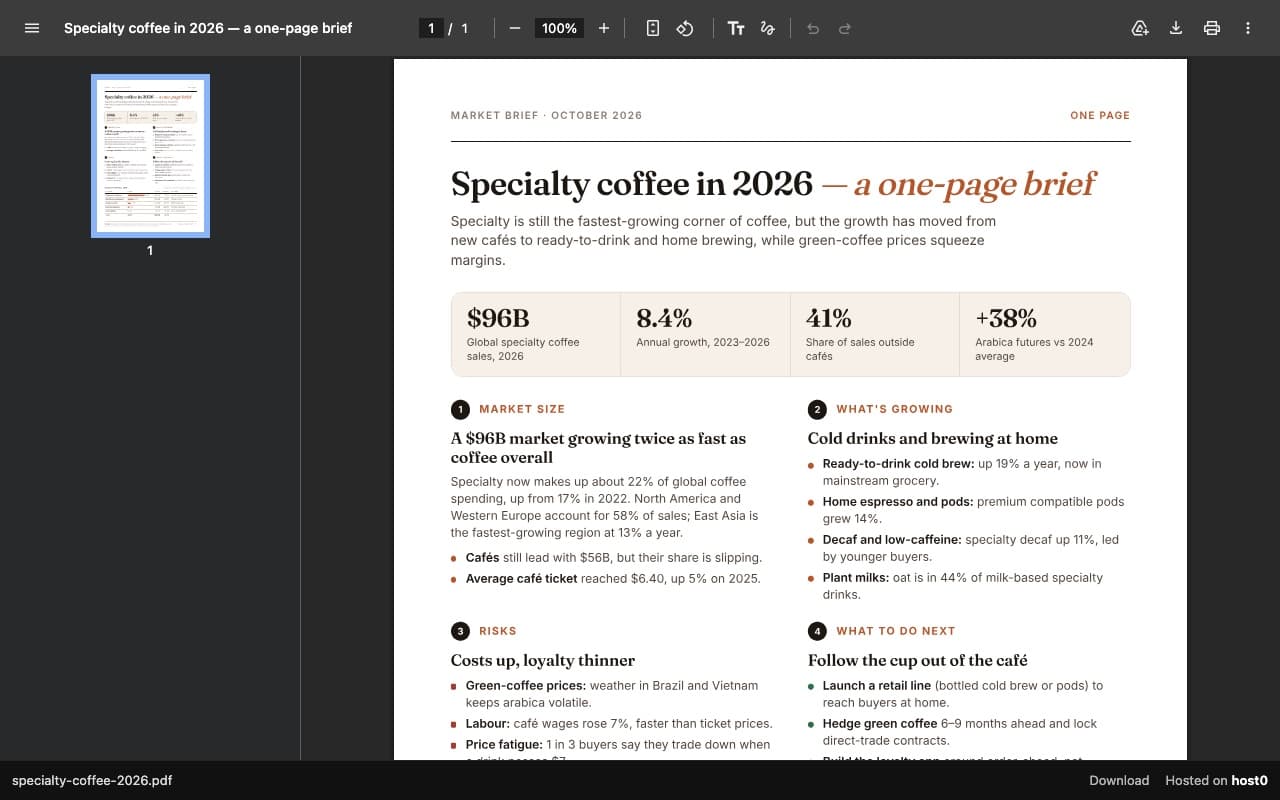
A PDF report that opens in any browser, with a download button.
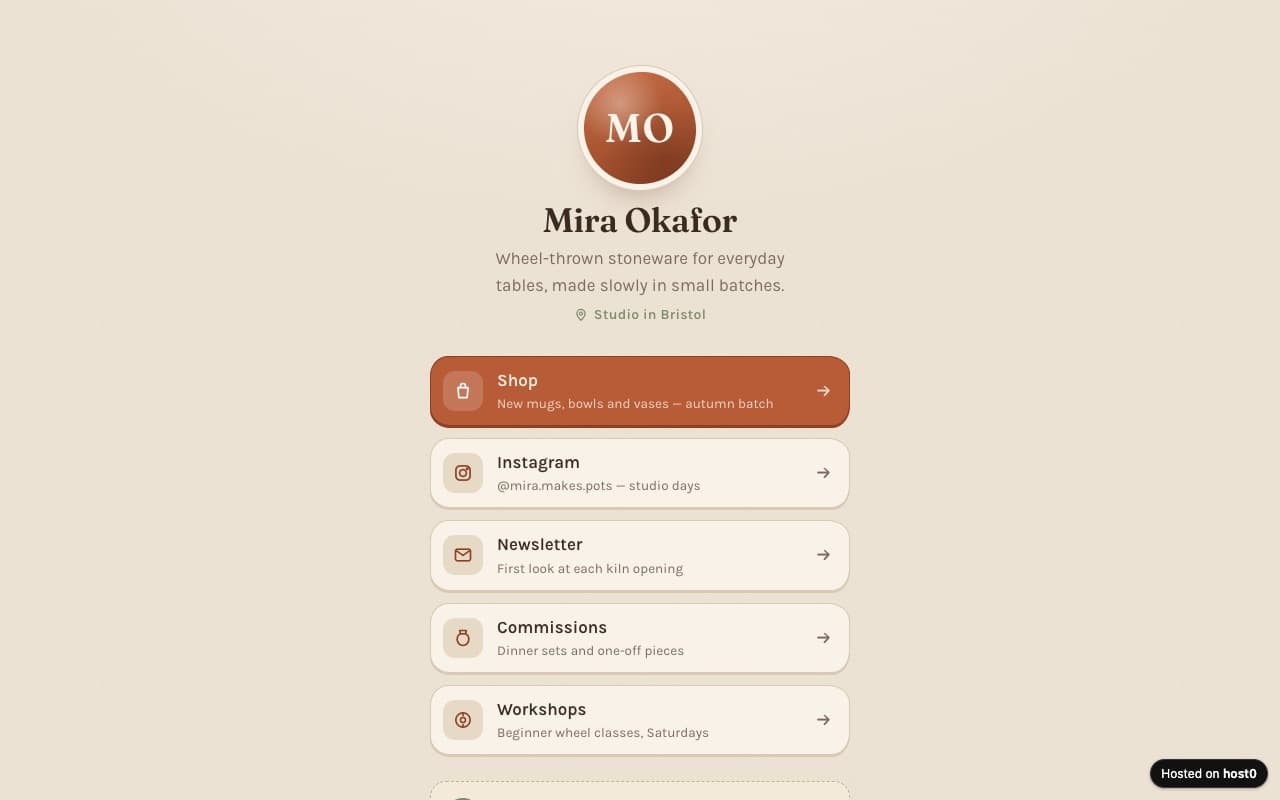
A personal page with your links, styled your way, in one file.
Your agent builds it, host0 hosts it
A live link from any agent, in your own account. host0 is free to start.
Get started